| General Plot Properties |
Example
In this example, you label observations in a scatter plot according to values of a third variable.
| Open the Hurricanes data set and create a scatter plot of wind_kts versus min_pressure. |
The scatter plot appears, as shown in Figure 9.12.
| Click on an observation. |
The selected observation is labeled by its position in the data table.
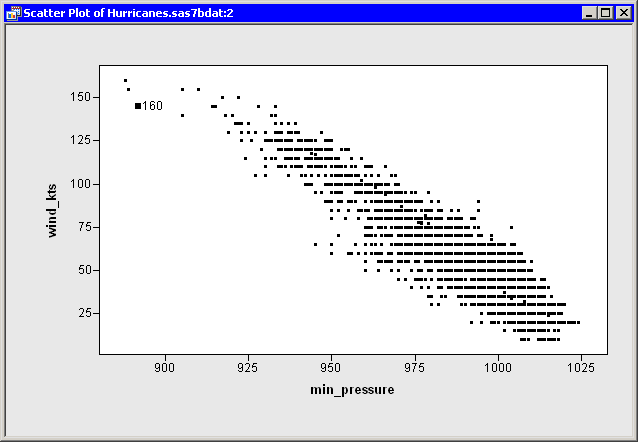 |
Figure 9.12: A Scatter Plot
| Right-click near the center of the plot, and select Plot Area Properties from the pop-up menu. |
A dialog box appears, as shown in Figure 9.13.
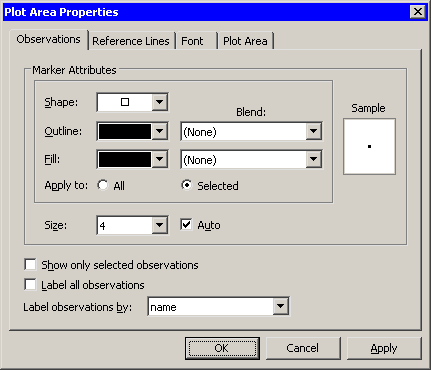 |
Figure 9.13: The Observations Tab
| Select name from the Label observations by list. |
| Click OK. |
The label for the selected observation updates, as shown in Figure 9.14. If you click on subsequent observations, each label displays a storm name.
 |
Figure 9.14: Labeling Only Selected Observations
Note: Only the scatter plot is affected by selecting Label observations by on the Observations tab of the Plot Area Properties dialog box. If you create a second plot, that new plot defaults to using observation numbers to label observations.
You can also set a default label variable that is used for all plots. In the data table, right-click on a variable heading. Select Label from the pop-up menu, as shown in Figure 9.15. The values of the selected variable are displayed when you click on observations in a plot (unless that plot overrides the default).
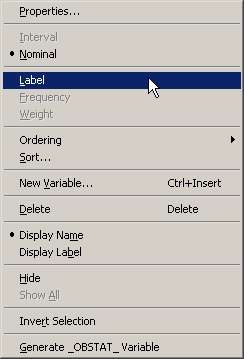 |
Figure 9.15: The Variables Menu
Copyright © 2009 by SAS Institute Inc., Cary, NC, USA. All rights reserved.