| Interacting with Plots |
The Observation Inspector
You can interactively query plots to display the values of variables for the observations beneath the mouse pointer. The discussion in this section applies to plots that show individual markers for each observation.
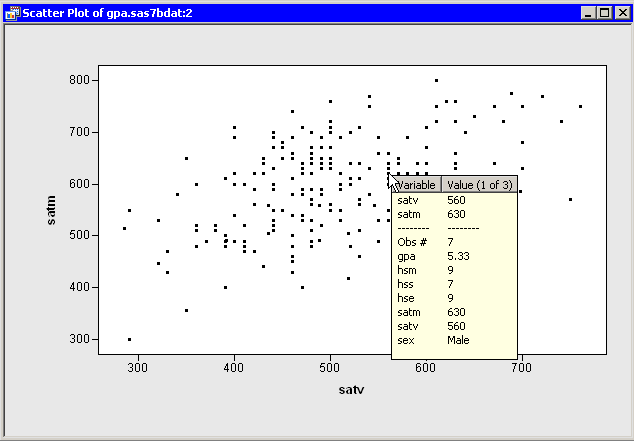
The observation inspector window (Figure 8.8) displays the values of all the variables for a particular observation. You can display the observation inspector window in one of three ways:
- Hold down the F2 key. The observation inspector window appears for any observations beneath the mouse pointer.
- Press the F2 key while holding down the SHIFT key. You are now in observation inspector mode. If you hover the mouse pointer over an observation, the observation inspector window appears. To exit observation inspector mode, press the ESC key while the observation inspector is active, or press SHIFT+F2 a second time.
- Double-click on an observation.
 |
Figure 8.8: The Observation Inspector Window
The top portion of the observation inspector window displays the variables used by the plot. For example, the observation inspector window for a scatter plot displays the X- and Y-axis variables first. If observations are labeled by some variable, that label variable also appears. The observation inspector window next displays a horizontal line, followed by the observation number (in the current sort order), followed by all variables in the order in which they appear in the data set.
If there are many variables, it is possible that not all of the variables fit into the observation inspector window. You can scroll the observation inspector window by using the HOME, END, PAGE UP, PAGE DOWN, UP ARROW, and DOWN ARROW keys.
If there are multiple observation markers near the mouse pointer (as in Figure 8.8), the observation inspector creates a list of all the nearby observations and displays the text ``Value (1 of N)'' in its column heading. You can display the next observation in the list by pressing the RIGHT ARROW key. You can go back to a previous observation by pressing the LEFT ARROW key. Pressing RIGHT ARROW or LEFT ARROW while holding down the SHIFT key jumps forward or backward to the observation that is approximately N/5 entries away in the list.
Copyright © 2009 by SAS Institute Inc., Cary, NC, USA. All rights reserved.