| Multivariate Analysis: Canonical Correlation Analysis |
The Plots Tab
You can use the Plots tab (Figure 28.9) to create plots that graphically display results of the analysis.
Creating a plot adds canonical variables to the data table. The following plots are available:
- Matrix of canonical score plots
- creates a plot for each pair of canonical variables that summarizes the strength of the relationship between the variables.
- Add regression line
- adds a least squares regression line to each score plot. The regression line predicts the
 th canonical variable in the second group from the th canonical variable in the first group.
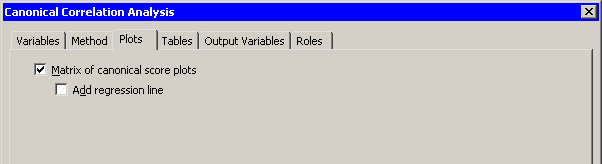 |
Figure 28.9: The Plots Tab
Copyright © 2009 by SAS Institute Inc., Cary, NC, USA. All rights reserved.