| Running Custom Analyses |
Running a User Analysis from the Main Menu
You can create your own custom analyses by writing an IMLPlus program. An introduction to IMLPlus programming is described in SAS/IML Studio for SAS/STAT Users and in the SAS/IML Studio online Help. You can display the online Help by selecting Help ![]() Help Topics from the main menu.
Help Topics from the main menu.
When you select Analysis ![]() User Analysis from the main menu, SAS/IML Studio calls a module called UserAnalysis. SAS/IML Studio distributes a sample UserAnalysis module as an example of the sort of analyses that you can write. You can copy and modify the UserAnalysis module to execute your own IMLPlus programs.
User Analysis from the main menu, SAS/IML Studio calls a module called UserAnalysis. SAS/IML Studio distributes a sample UserAnalysis module as an example of the sort of analyses that you can write. You can copy and modify the UserAnalysis module to execute your own IMLPlus programs.
The following steps run the sample UserAnalysis module.
| Open the Baseball data set. |
| Select Analysis |
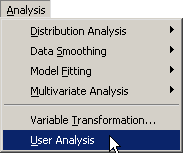 |
Figure 33.1: Running a User Analysis
The sample UserAnalysis module displays a simple dialog box (Figure 33.2) containing a list of analyses that you can run on the data. The dialog box displays a list of two analyses.
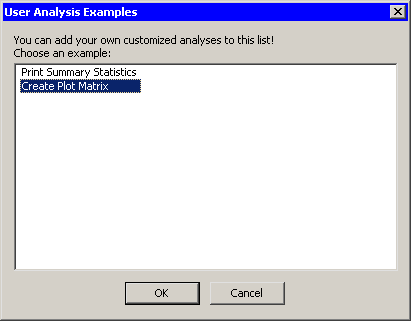 |
Figure 33.2: Selecting from a List of Analyses
| Select Create Plot Matrix and click OK. |
The Create Plot Matrix analysis demonstrates one way to query information from the person running the analysis. In this case, the program prompts you to select several variables to plot. If you select ![]() variables from this list, the variables will be plotted against each other in an
variables from this list, the variables will be plotted against each other in an ![]() lower-triangular array of plots of the pairwise combination of variables.
lower-triangular array of plots of the pairwise combination of variables.
| Hold down the CTRL key and select yr_major, cr_atbat, league, and division, as shown in Figure 33.3. Click OK. |
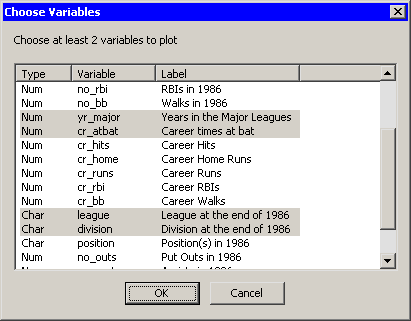 |
Figure 33.3: Selecting Variables
These four variables are plotted in pairwise combinations, as shown in Figure 33.4. Three different plots are created. Mosaic plots display the relationship between pairs of nominal variables. Box plots are used to plot an interval variable against a nominal variable. Scatter plots display the relationship between pairs of interval variables. Windows along the diagonal display variable names and values of each axis.
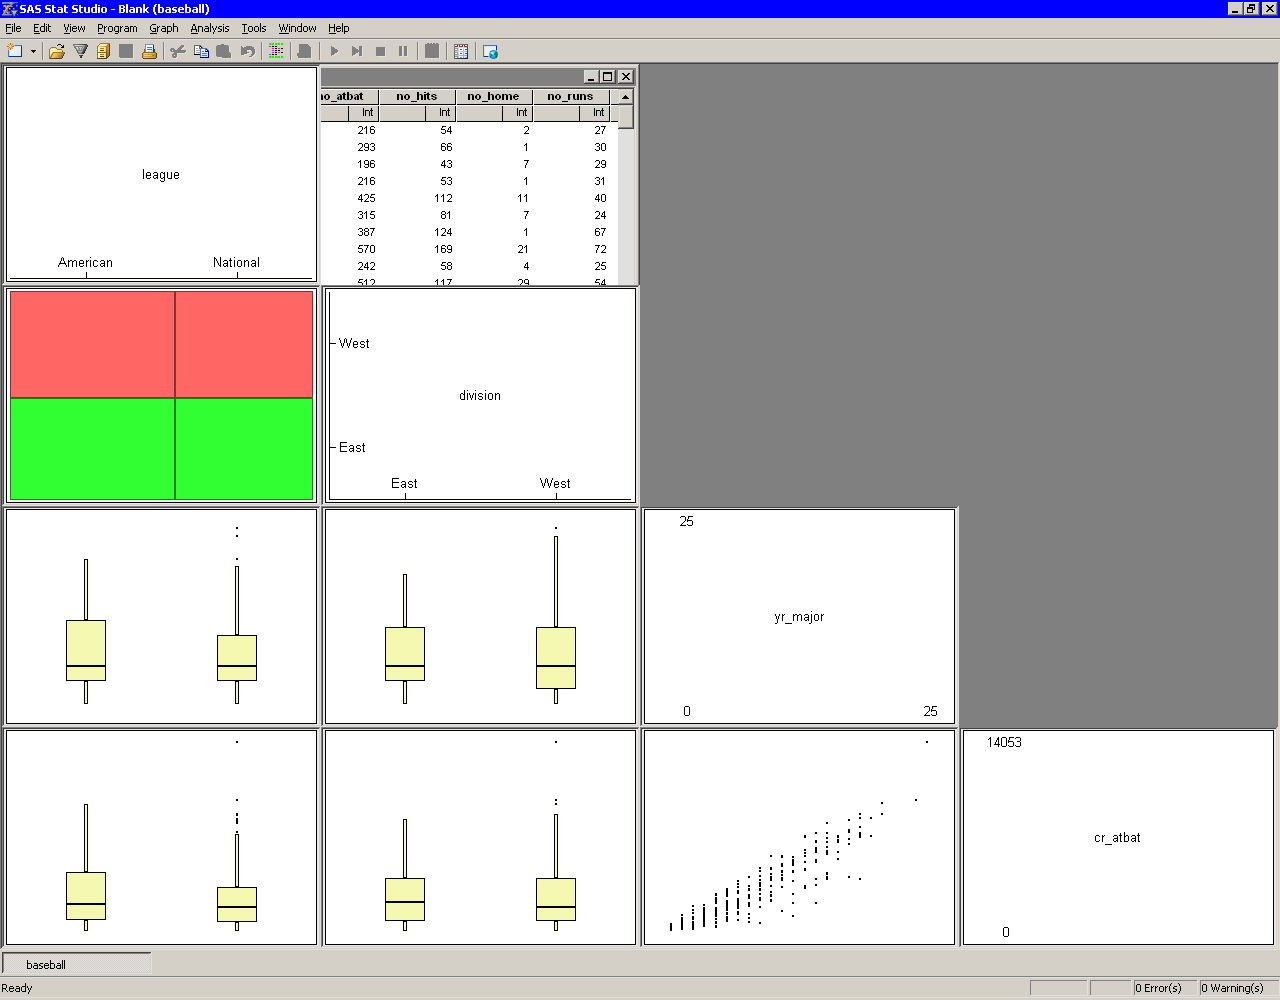 |
Figure 33.4: The Results of the Analysis
You can modify the UserAnalysis module to call your own analyses from the Analysis ![]() User Analysis menu item. To create your own UserAnalysis module, do the following:
User Analysis menu item. To create your own UserAnalysis module, do the following:
- Copy the UserAnalysis.sxs file distributed with SAS/IML Studio to your personal modules directory. The UserAnalysis.sxs file is distributed in the Modules\System subdirectory of the SAS/IML Studio installation directory. Your personal modules directory is usually the Modules subdirectory of your personal files directory. (See "The Personal Files Directory" for more information about the personal files directory.)
- Edit your personal copy of the UserAnalysis.sxs file. Modify the body of the UserAnalysis module so that it performs an analysis of your choosing.
- Save the file.
- Select Program
 Run to store the module.
 - Open any data set, and choose Analysis User Analysis to run the module.
The UserAnalysis module must take a DataObject variable as its single argument. When you select Analysis ![]() User Analysis, the module is called. The currently active DataObject is used as the argument to the module.
User Analysis, the module is called. The currently active DataObject is used as the argument to the module.
Table 33.1 lists a few of the methods in the DataObject class. You might find these methods useful in writing your analyses. These and other IMLPlus class methods are documented in the SAS/IML Studio online Help, in the "DataObject" section of the ``IMLPlus Class Reference'' chapter.
Table 33.1: Frequently Used DataObject MethodsFor example, you could modify the body of the UserAnalysis module to include the following statements. If you select a nominal variable from a data table and then select Analysis ![]() User Analysis, these statements assign a distinct marker shape to each unique value of the nominal variable. (If there are more unique values than marker shapes, the shapes are reused.) The NCOL, UNIQUE, LOC, and MOD functions are all part of the SAS/IML language, as are the IF and DO statements.
User Analysis, these statements assign a distinct marker shape to each unique value of the nominal variable. (If there are more unique values than marker shapes, the shapes are reused.) The NCOL, UNIQUE, LOC, and MOD functions are all part of the SAS/IML language, as are the IF and DO statements.
 start UserAnalysis(DataObject dobj);

 dobj.GetSelectedVarNames(VarName); /* get selected var name */
 if ncol(VarName) = 0 then return;  /* return if no selected variable */
 if dobj.IsNominal(VarName) then do;/* if it is nominal... */
    shapes = MARKER_SQUARE || MARKER_PLUS || MARKER_CIRCLE ||
             MARKER_DIAMOND ||MARKER_X || MARKER_TRIANGLE ||
             MARKER_INVTRIANGLE || MARKER_STAR;
    dobj.GetVarData(VarName, x);    /* get the data */
    ux = unique(x);                 /* find the unique values */
    do i = 1 to ncol(ux);           /* for each unique value... */
       idx = loc(x = ux[i]);        /* find obs with that value */
       iShape = 1 + mod(i-1, 8);    /* choose next shape (mod 8) */
       /* set the shape of the relevant observations */
       dobj.SetMarkerShape(idx, shapes[iShape]);
    end;
 end;

 finish;
 store module=UserAnalysis;
Copyright © 2009 by SAS Institute Inc., Cary, NC, USA. All rights reserved.