Draw a Curve from Variables in a Data Set or from a SAS/IML Matrix
Sometimes the number of observations in your data is different from the number of observations in an output data set created by a procedure. This eliminates the possibility of reading the output into the DataObject that contains the original data.
For example, you can use the SCORE procedure to evaluate a linear model on a separate set of values of the explanatory variables. Or you can use the SCORE statement of the LOESS, GAM, or TPSPLINE procedure to evaluate a nonparametric model. In each of these cases, you can read variables from the output data set by using the SAS/IML USE and READ statements and then use the DrawLine method to add the relevant curve to a plot.
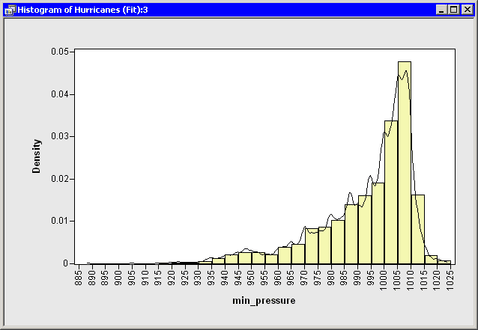
As an example of this approach, suppose you want to add a kernel density estimate to a histogram of the min_pressure variable. You can do this by calling the KDE procedure. Add the following statements at the bottom of the program window, and select Program  Run from the main menu.
   submit;
   proc kde data=Hurr;
      univar min_pressure / out=KDEOut;
      run;
   endsubmit;
The KDE procedure creates the data set Work.KDEout on the SAS server with 401 observations. The data set contains a variable Value that consists of evenly spaced points between the minimum and maximum values of min_pressure. A variable named Density contains the kernel density estimate evaluated at the points of Value.
Note:You do not need to use the SORT procedure to sort this data set by Value, because it was created in sorted order. However, for unsorted data, you need to sort by the independent variable.
A straightforward approach is to create a histogram and add the kernel density estimate by reading in the Work.KDEout data set. Add the following statements at the bottom of the program window, and select Program Run from the main menu.
   use KDEOut;
   read all var {value density};
   close KDEOut;

   declare Histogram hist;
   hist = Histogram.Create( dobj, "min_pressure" );
   hist.ShowDensity(); /* show density instead of frequency */
   hist.DrawUseDataCoordinates();
   hist.DrawLine( value, density );
Figure 6.4 displays the resulting histogram and the overlaid kernel density estimate.