Changing Box Plot Display
The SAS System defines
many graphical style elements. Some have a very narrow scope, such
as those that control the display of box plots. Using these style
elements as a starting point, you can change the style attribute values
to achieve a very different appearance for your box plots. The same
is true for histograms, contours, and some other plot types.
Using the DEFAULT style
for an example, here is a portion of the style definition for elements
that are related to box plots:
proc template;
  define style Styles.Default;
  ...
  style GraphBox /
     capstyle = "serif"
     connect = "mean"
     displayopts = "fill caps median mean outliers";
  style GraphBoxMean / ... ;
  style GraphBoxMedian / ... ;
  style GraphBoxOutlier / ... ;
  style GraphBoxWhisker / ... ;
  ...
  end;
run;
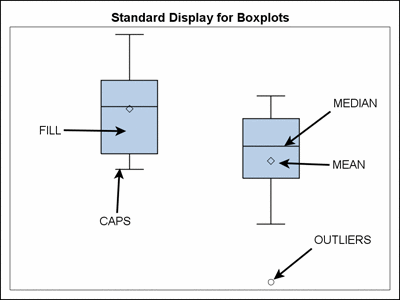
The DISPLAYOPTS
attribute of GraphBox lists the general features to be displayed.
The following diagram shows the standard display for box plots, as
defined by the DEFAULT style. The keywords that are related to the
appearance features are annotated:
The STATISTICAL style
is derived from the DEFAULT style and inherits the GraphBox element
from the parent DEFAULT style. The following code generates a box
plot for the STATISTICAL style:
proc template;
   define statgraph boxplotdef;
   begingraph;
      entrytitle "Statistical Style";
      layout overlay / xaxisopts=(label="Age" type=linear);
         boxplot x=ageatstart y=cholesterol / intervalboxwidth=40;
      endlayout;
   endgraph;
end;

ods graphics on / outputfmt=static;
ods html style=statistical;

proc sgrender data=sashelp.heart template=boxplotdef;
   where ageatstart between 50 and 55;
run;

ods graphics off;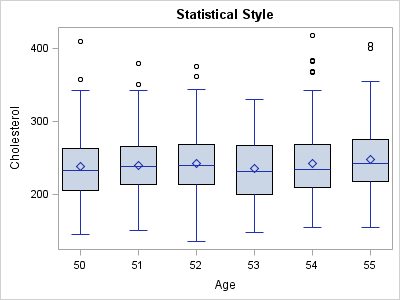
To make these changes,
we can derive a new style from
the STATISTICAL style and set the attributes that we want to change.
Any attribute settings that we do not change are inherited
from the parent STATISTICAL style. The following style definition
effects the desired changes:
proc template;
  define style Styles.Boxplot;
  parent = styles.statistical;
    style GraphBox from GraphBox /
      capstyle = "line"
      displayopts = "caps median mean outliers notches";
    style GraphBoxMean from GraphBoxMean /
      markersymbol="diamondfilled"
      contrastcolor=GraphColors("gcdata1")
      markersize = 5px;
    style GraphOutlier from GraphOutlier /
      markersize = 5px
      markersymbol = "x"
      contrastcolor = GraphColors("gcdata2");
    end;
run;
proc template;
   define statgraph boxplotdef;
   begingraph;
      entrytitle "Boxplot Style";
      layout overlay / xaxisopts=(label="Age" type=linear);
         boxplot x=ageatstart y=cholesterol / intervalboxwidth=40;
      endlayout;
   endgraph;
end;

ods graphics on / outputfmt=static;
ods html style=Styles.Boxplot;

proc sgrender data=sashelp.heart template=boxplotdef;
   where ageatstart between 50 and 55;
run;

ods graphics off;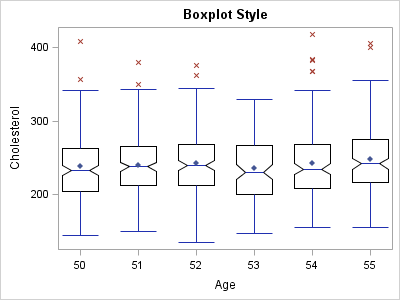
When making such style
changes remember that you are affecting all box plot displays for
all procedures that produce box plots when this style is in effect.
It is possible to change the box plot appearance for specific procedures,
but to do this, a specific graph template must be modified, not a
style template.