The Graph Template Language
Overview of the Graph Template Language
The Graph Template Language
is the heart of ODS Graphics. All of the graphs that are created
by the SAS analytical procedures and by the SAS Statistical Graphics
Procedures are generated using GTL. Users who need to go beyond the
graphs created by these SAS procedures can use GTL directly to design
their graphs using the TEMPLATE and SGRENDER procedures. To successfully
create or modify GTL templates, you need the information in this User's
Guide, which helps you understand important concepts and offers many
complete code examples illustrating often used features. You also
need access to the SAS Graph Template Language: Reference, which
is the language dictionary for GTL.
Defining the Graph Template
GTL uses a structured
"building-block" approach to defining a graph. The syntax provides
a set of layout, plot, and other statements to define the graph. ODS Graph and the Template to Generate It shows a graph
of car profiles by horsepower and the syntax necessary to define the
graph using GTL.
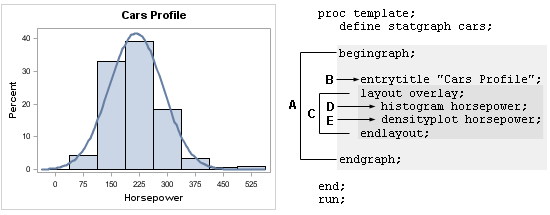
The template definition
consists of the following parts:
| A. The GTL syntax block from BEGINGRAPH to ENDGRAPH. |
| B. The title for the graph. |
| C. The LAYOUT OVERLAY block. The results of the statements in this block are overlaid in the graph. |
| D. A histogram of the horsepower variable. |
| E. A density plot of the horsepower variable. |
Running the program
in ODS Graph and the Template to Generate It creates the
CARS template and saves it in an item store.
Creating the Graph
To create the graph in ODS Graph and the Template to Generate It, the SGRENDER
procedure is run to associate the appropriate data set with the compiled
template:
proc sgrender data=sashelp.cars template=cars; run;
In the template definition,
the HORSEPOWER variable is used explicitly for the HISTOGRAM and DENSITYPLOT
statements. The explicit reference in the template to a variable
named HORSEPOWER requires that the data set have a numeric column
named HORSEPOWER. Using Dynamics and Macro Variables to Make Flexible Templates shows you how to make the template more flexible.
When GTL is Needed
-
The graphs that are created by the analytical procedures use predefined GTL templates. These templates are designed by SAS procedure writers and shipped with SAS. Every graph created by these procedures has a corresponding template stored in the SASHELP.TMPLMST item store. To customize these templates, you must develop a basic understanding of the GTL.
-
Often analysts need graphs of the data before an analysis can be started. Or, the results of a complex analysis involving multiple procedures or DATA steps need to be presented as graphs. Although many of these tasks can be accomplished using the SG Procedures, those procedures do not provide many of the advanced layout capabilities of GTL. To create such custom graphs, you must develop a basic understanding of the GTL.