Conditional Logic
GTL supports conditional
logic that enables you to include or exclude one or more GTL statements
at run time:
IF ( condition )
GTL statement(s);
ELSE
GTL statement(s);
ENDIF ;
The IF statement requires
an ENDIF statement, which delimits the IF block. The IF block can
be placed anywhere within the BEGINGRAPH / ENDGRAPH block.
The condition is an expression that evaluates to
a numeric constant, where all numeric constants other than 0 and MISSING
are true. The IF block is evaluated with an implied EVAL( condition ), so it is not necessary to include
an EVAL as part of the condition.
Note: Dynamic variables that are
initialized to an ODS-recognized value, such as YES, NO, TRUE, or
FALSE, do not work as expected when used as an expression in an IF-THEN
statement. In that case, the expression is treated as a string, which
always evaluates to a positive integer value (FALSE).
/* test a computed value */
if (weekday(today()) in (1 7))
   entrytitle "Run during the weekend";
else
   entrytitle "Run during the work week";
endif;

/* test for the value of a numeric dynamic */
if ( ADDREF > 0 )
   referenceline y=1;
   referenceline y=0;
   referenceline y=-1;
endif;

/* test for the value of a character dynamic */
if ( upcase(ADDREF) =: "Y")
   referenceline y=1;
   referenceline y=0;
   referenceline y=-1;
endif;

/* test whether a dynamic is initialized */
if (exists(ADDREF))
   referenceline y=1;
   referenceline y=0;
   referenceline y=-1;
endif;
The GTL conditional logic is used only for determining
which statements to render. It is not used to control what is in the
data object. In the following example, the data object contains columns
for DATE, AMOUNT, and LOG10(AMOUNT), but only one scatter plot is
created.
if ( LOGFLAG )
  scatterplot x=date y=amount;
else
  scatterplot x=date y=eval(log10(amount));
endif;
For the conditional
logic in GTL, it is seldom necessary to test for the existence of
option values that are set by columns or dynamics. Consider the following
statement:
scatterplot x=date y=amount / group=GROUPVAR;
This SCATTERPLOT statement
is equivalent to the following code because option values that are
set by columns that do not exist, or by dynamics that are uninitialized,
simply "drop out" at run time and do not produce errors or warnings:
if ( exists(GROUPVAR) )
  scatterplot x=date y=amount / group=GROUPVAR;
else
  scatterplot x=date y=amount;
endif;
The GTL code that is specified in the
conditional block must contain complete statements and / or complete
blocks of statements. For example, the following IF block produces
a compile error because there are more LAYOUT statements than ENDLAYOUT
statements:
/* produces a compile error */
if ( exists(SQUAREPLOT) )
  layout overlayequated / equatetype=square;
else
  layout overlay;
endif;

    scatterplot x=XVAR y=YVAR;
endlayout;
if ( exists(SQUAREPLOT) )
  layout overlayequated / equatetype=square;
    scatterplot x=XVAR y=YVAR;
  endlayout;
else
  layout overlay;
    scatterplot x=XVAR y=YVAR;
  endlayout;
endif;
IF ( condition )
GTL statement(s);
ELSE
IF ( condition )
GTL statement(s);
ELSE
GTL statement(s);
ENDIF ;
ENDIF ;
The following example
creates a generalized histogram that conditionally shows the variable
label and combinations of fitted distribution curves:
proc template;
  define statgraph conditional;
    dynamic NUMVAR "required" SCALE CURVE;
    begingraph;
      entrytitle "Distribution of  " eval(colname(NUMVAR));

      if ( colname(NUMVAR) ne collabel(NUMVAR) )
        entrytitle "(" eval(collabel(NUMVAR)) ")";
      endif;

      layout overlay / xaxisopts=(display=(ticks tickvalues line));
        histogram NUMVAR / scale=SCALE;

        if ( upcase(CURVE) in ("ALL" "NORMAL" ) )
          densityplot NUMVAR / normal() name="N"
            lineattrs=GraphData1 legendlabel="Normal Distribution";
        endif;

        if ( upcase(CURVE) in ("ALL" "KDE" "KERNEL") )
          densityplot NUMVAR / kernel() name="K"
            lineattrs=GraphData2 legendlabel="Kernel Density Estimate";
        endif;
        discretelegend "N" "K";
      endlayout;

    endgraph;
  end;
run;
-
The next two IF blocks evaluate the value of the dynamic variable CURVE. If CURVE is not used, the code in the conditional blocks is not executed. If CURVE is initialized to one of the strings "all" or "normal" in any letter case, then the first DENSITYPLOT statement is executed. If CURVE is initialized to one of the strings "all", "kde", or "kernel" in any letter case, then the second DENSITYPLOT statement is executed. Thus, the results of the conditional logic determine whether zero, one, or two density plots are generated in the graph.
After submitting the
template code, we can execute the template with various combinations
of dynamic values.
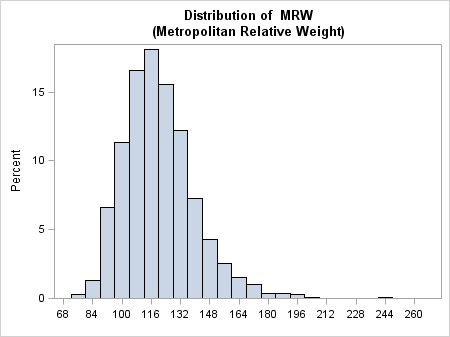
In this first execution,
the NUMVAR dynamic is initialized with a column that has a defined
label, so two title lines are generated. The first title line displays
the column name, and the second title line displays the column label.
The CURVE dynamic is not initialized, so the template does not generate
a density plot.
proc sgrender data=sashelp.heart template=conditional;
  dynamic numvar="mrw";
run;
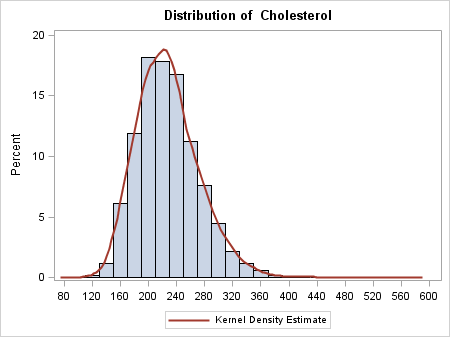
In this next execution
of the template, the NUMVAR dynamic is initialized with a column that
does not have a label, so only a single title line is displayed in
the graph. The CURVE dynamic is initialized with the value "kde",
so in addition to the histogram, the template generates a kernel
density estimate.
proc sgrender data=sashelp.heart template=conditional;
  dynamic numvar="cholesterol" curve="kde";
run;
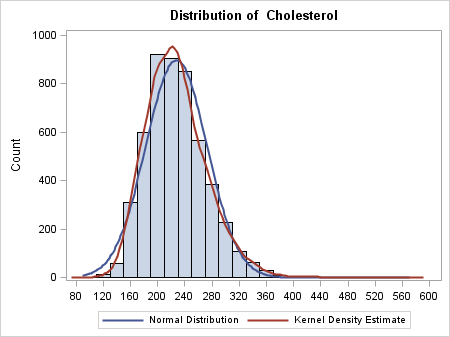
In this final execution
of the template, the CURVE dynamic is initialized with the value "all",
so in addition to the histogram, the template generates a normal density
estimate and a kernel density estimate.