Functions
Overview of the Functions that are Supported in GTL
GTL supports a large
number of functions, including SAS functions that can be used in the
context of a WHERE expression, and other functions that are defined
only in GTL.
General Functions Supported Only in GTL
The following table
shows functions that are used only in GTL. In all of these functions, column can be either the name of a column in
the input data set, or a dynamic variable or macro variable that resolves
to a column.
|
sorts all of the data
object's columns by the values of column. ASORT sorts in ascending order, while DSORT sorts in descending
order. SORT is an alias for ASORT.
|
|
/* arrange bars in descending order of response values */
 barchartparm x=region y=eval(dsort(amount,retain=all));

/* Label outliers with their position in the data set.
   It does not matter which column is used for NUMERATE(). */
boxplot x=age y=weight / datalabel=eval(numerate(age));

/* Add information about the column being processed.
   The column name is passed by a dynamic. */
entrytitle "Distribution for " eval(colname(DYNVAR));
GTL Summary Statistic Functions
The following functions
return a numeric constant, based on a summary operation that is performed
on a numeric column. The results of these functions are the same as
if the corresponding statistics were requested with PROC SUMMARY.
These functions take a single argument, which resolves to the name
of a numeric column. They take precedence over similar multi-argument
DATA step functions.
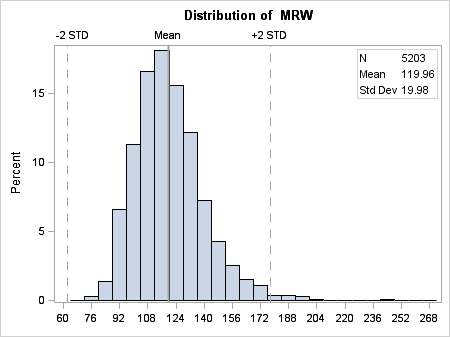
The following example
uses GTL summary statistic functions to dynamically construct reference
lines and a table of statistics for a numeric variable, which is supplied
at run time.
proc template;
 define statgraph expression;
  dynamic NUMVAR "required";
  begingraph;
   entrytitle "Distribution of  " eval(colname(NUMVAR));
   layout overlay /  xaxisopts=(display=(ticks tickvalues line));
    histogram NUMVAR;

	 /* create reference lines at computed positions */
    referenceline x=eval(mean(NUMVAR)+2*std(NUMVAR)) /
      lineattrs=(pattern=dash) curvelabel="+2 STD";
    referenceline x=eval(mean(NUMVAR)) /
      lineattrs=(thickness=2px) curvelabel="Mean";
    referenceline x=eval(mean(NUMVAR)-2*std(NUMVAR)) /
      lineattrs=(pattern=dash) curvelabel="-2 STD";

 /* create inset */
    layout gridded / columns=2 order=rowmajor
      autoalign=(topleft topright) border=true;
     entry halign=left "N";
     entry halign=left eval(strip(put(n(NUMVAR),12.0)));
     entry halign=left "Mean";
     entry halign=left eval(strip(put(mean(NUMVAR),12.2)));
     entry halign=left "Std Dev";
     entry halign=left eval(strip(put(stddev(NUMVAR),12.2)));
    endlayout;
   endlayout;
  endgraph;
 end;
run;

proc sgrender data=sashelp.heart template=expression;
  dynamic numvar="MRW";
run;