Default Appearance Features in Graphs
Graphs that are produced with GTL
derive their general default appearance features (fonts, colors, line
properties, and marker properties) from the current ODS style. The
following three images show the same graph that is rendered with three
different styles.
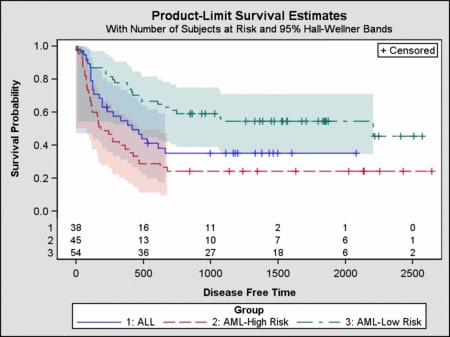
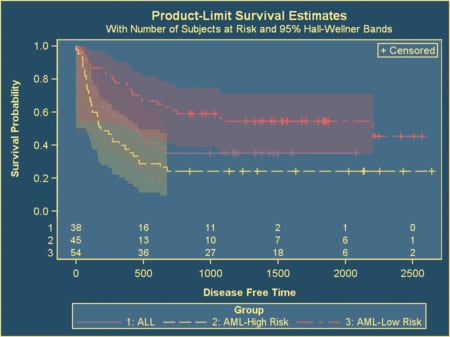
An important point to
note, here, is that the appearance of the graph changes when the template
is executed, not when it is compiled.
Fully one third of all
GTL syntax addresses matters of appearance. Yet, most of the examples
in this document do not use the appearance syntax because the examples
take advantage of the pre-defined styles. Whenever the options in
your graph template explicitly change a color or font family, you
are locking those decisions into the compiled template. Appearance
options in GTL always override any similar appearance settings contained
in the style. Thus, setting a fixed font or color appearance option
might yield satisfactory results with some styles but not with others.
For that reason, the compiled graph and table templates that are included
with many SAS procedures do not contain references to fixed fonts
and colors.
This chapter shows "best
practices" to follow so that your GTL programs integrate style definitions
to create the look that you desire in your graphics output. The coding
strategy that you use depends on how much style integration you need.
If you want to change the appearance of all your graphs or apply a
custom style to them, you can define your own style. For details, see Managing the Graph Appearance with Styles.