Evaluating Supplied Styles

Over fifty ODS styles are available for use with GTL graphs. These styles are stored in the SASHELP.TMPLMST item store under the STYLES directory. To list the names of all the supplied templates in the SAS Output window, you can submit the following program:
proc template;
 path sashelp.tmplmst;
 list styles;
run;
Listing of: SASHELP.TMPLMST
Path Filter is: Styles
Sort by: PATH/ASCENDING

Obs    Path                         Type
_________________________________________
 1     Styles                       Dir
 2     Styles.Analysis              Style
 3     Styles.Astronomy             Style
 4     Styles.Banker                Style
 (more )
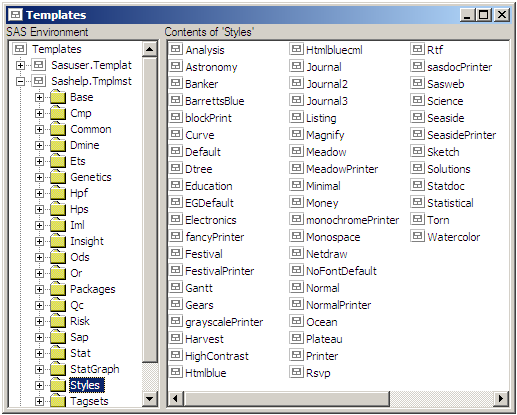
You can also browse the styles interactively using the Templates window. To do so, issue the ODSTEMPLATE command to open the Templates window, and then select STYLES under the SASHELP.TMPLMST item store.
Viewing Style Definitions in the Templates Window
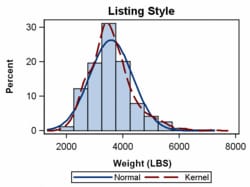
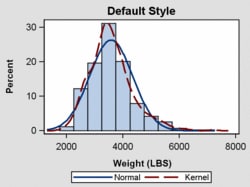
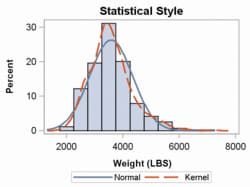
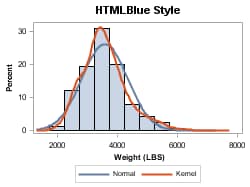
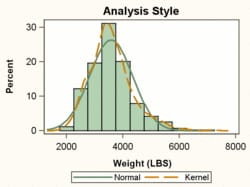
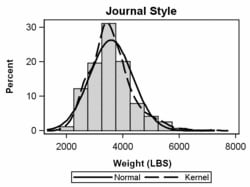
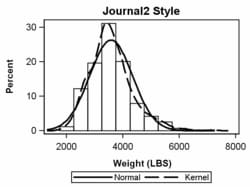
Some of the ODS styles have been around for a long time, before the introduction of ODS Graphics. All styles will work with ODS Graphics, but many of the older ones have not been fully optimized for ODS Graphics. Below is a list of recommended styles and a brief description of each.
Style
Example
LISTING
  • white background
  • white wall
  • sans-serif fonts
  • color used for lines, markers, and filled areas
  • other colors the same as DEFAULT style
Graph with LISTING Style
DEFAULT
  • gray background
  • white wall
  • sans-serif fonts
Graph with DEFAULT Style
STATISTICAL
  • white background
  • white wall
  • sans-serif fonts
  • contrasting color scheme of blues, reds, greens for markers, lines, and filled areas
Graph with STATISTICAL Style
HTMLBLUE
  • white background
  • white wall
  • sans-serif fonts
  • table colors match the graph colors
  • group distinctions based on color rather than marker or line styles
  • a lighter color scheme for HTML content
Graph with HTMLBLUE Style
ANALYSIS
  • light tan background
  • white wall
  • sans-serif fonts
  • muted color scheme of tans, greens, yellows, oranges and browns for lines, markers, and filled areas
Graph with ANALYSIS Style
JOURNAL and JOURNAL3
  • white background
  • white wall
  • sans-serif fonts
  • gray-scale color scheme for markers, lines, and filled areas
  • gray-scale pattern and color scheme for bar fill patterns (JOURNAL3 only)
Graph with JOURNAL Style
JOURNAL2
  • white background
  • white wall
  • sans-serif fonts
  • black-only scheme for markers, lines, and bar fill patterns
  • no solid filled areas—a minimal ink style
Graph with JOURNAL2 Style