Creating an Inset as a Table of Text
Perhaps the most common
use for an inset is to display a table of statistics within the graph.
This section shows how to construct that type of basic table. Later
examples show how to make the contents of the table more dynamic and
how to integrate the table into the graph.
The basic technique for constructing
the table is to place several ENTRY statements in a LAYOUT GRIDDED
block. Each ENTRY statement becomes a cell of the grid. ENTRY statement
options and layout options are used to further organize the table.
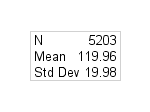
The simplest technique for creating the table is to construct
a one-column, three-row table. The following example uses three ENTRY
statements: one for each row in the table. The statistic name is left-justified
in each row, and the statistic value is right-justified:
layout gridded / columns=1  border=true;
  entry halign=left "N"       halign=right "5203" ;
  entry halign=left "Mean"    halign=right "119.96" ;
  entry halign=left "Std Dev" halign=right "19.98" ;
endlayout;
Another technique is
to create the table with two columns and three rows. This approach
places each statistic name and statistic value in its own cell. Although
this technique requires six ENTRY statements, it is a more flexible
arrangement because each column alignment can be set independently.
The following example left-justifies the text for each ENTRY statement:
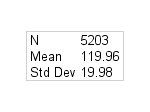
layout gridded / columns=2  order=rowmajor border=true;
  /* row 1 */
    entry halign=left "N";
    entry halign=left "5203";
  /* row 2 */
    entry halign=left "Mean";
    entry halign=left "119.96";
  /* row 3 */
    entry halign=left "Std Dev";
    entry halign=left "19.98";
endlayout;
ORDER=ROWMAJOR means
that cells are populated horizontally, starting from column 1, followed
by column 2, and then advancing to the next row. You should order
the ENTRY statements as shown. To add additional rows in the table,
just add additional pairs of ENTRY statements.
Of course, the LAYOUT
GRIDDED statement enables you to organize cells by column, so you
can achieve this same effect with ORDER=COLUMNMAJOR. The following
code fragment populates the cells vertically down the columns by populating
the first cell in row 1, followed by the first cell in row 2, followed
by the first cell in row 3, and then advancing to the next column.
layout gridded / rows=3 order=columnmajor border=true;
  /* column 1 */
    entry halign=left "N";
    entry halign=left "Mean";
    entry halign=left "Std Dev";
  /* column 2 */
    entry halign=left "5203";
    entry halign=left "119.96";
    entry halign=left "19.98";
endlayout;
In both cases, an HALIGN=LEFT
prefix option was added to each ENTRY statement to left-justify its
text (the default is HALIGN=CENTER). Note that the column widths in
the table are determined by the longest text string in each column
on a per column basis.
The following example illustrates how to change the column
justification and add extra space between the columns with the COLUMNGUTTER=
option. Borders have been added to the ENTRY statements to show the
text boundaries and alignment. Although it is not used in this example,
the LAYOUT GRIDDED statement also provides a ROWGUTTER= option to
add space between all rows.
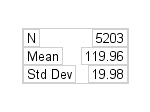
layout gridded / rows=3 order=columnmajor
                 columngutter=5px border=true;
  /* column 1 */
    entry halign=left "N"       / border=true;
    entry halign=left "Mean"    / border=true;
    entry halign=left "Std Dev" / border=true;
  /* column 2 */
    entry halign=right "5203"   / border=true;
    entry halign=right "119.96" / border=true;
    entry halign=right "19.98"  / border=true;
endlayout;
With the borders turned on in the layout, you should notice that
there is spacing that appears on the left and right of the ENTRY text.
The space is called padding, and it can be explicitly set with the
PAD= option in the ENTRY statement. The default padding (in pixels)
for ENTRY statements is
PAD=(TOP=0 BOTTOM=0 LEFT=3 RIGHT=3)You can adjust that padding as desired.
To embellish the basic inset table
with a spanning title, nest one GRIDDED layout within another GRIDDED
layout. In the following example, notice that the outer GRIDDED layout
has one column and two rows (the nested GRIDDED layout is treated
as one cell).
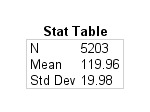
layout gridded / columns=1;
  entry textattrs=(weight=bold) "Stat Table";
  layout gridded / rows=3 order=columnmajor border=true;
  /* column 1 */
    entry halign=left "N";
    entry halign=left "Mean";
    entry halign=left "Std Dev";
  /* column 2 */
    entry halign=left "5203";
    entry halign=left "119.96";
    entry halign=left "19.98";
  endlayout;
endlayout;