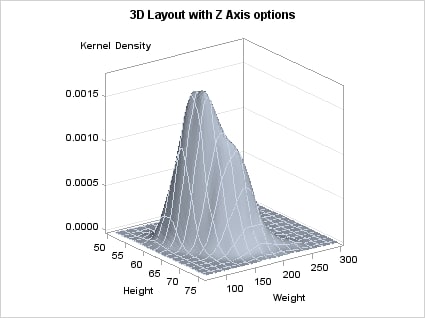
Basic Display Features of 3-D Graphs
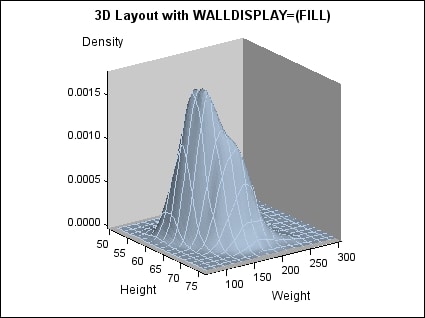
Displaying a Fill in the Graph Walls
By default, only the
outlines of the walls bounding the XY, XZ, and YZ axis planes are
shown. You can display filled walls by including the WALLDISPLAY=(FILL)
or WALLDISPLAY=(FILL OUTLINE) settings in the LAYOUT OVERLAY3D statement.
You can change the wall color (when filled) with the WALLCOLOR=option.
When filled, the wall lighting is adjusted to give a 3-D effect, based
on the graph viewpoint.
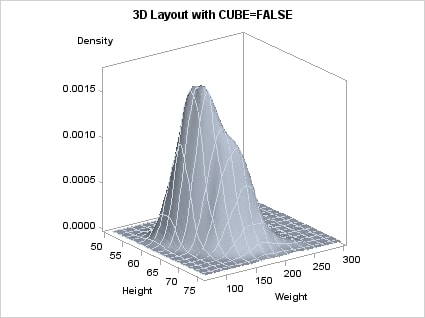
layout overlay3d / cube=false
    walldisplay=(fill) ;
  surfaceplotparm x=height y=weight
                  z=density;
endlayout;
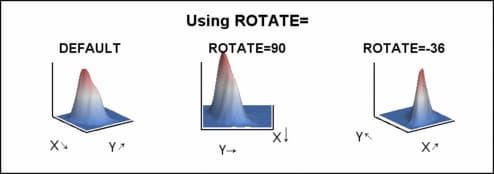
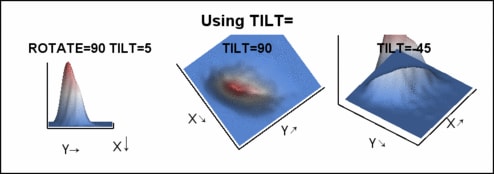
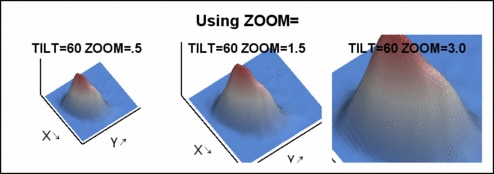
Defining a Viewpoint
Representing a 3-D graph
statically in two dimensions often obscures details that are better
viewed from a different viewpoint. Three options on the LAYOUT OVERLAY3D
statement can be independently set to obtain a different viewpoint.
These options can be
used in combination with each other to obtain a desired perspective.
The following figures show some examples. To generate the figures,
a LATTICE layout was used to "grid" a series of OVERLAY3D layouts
of the same plot with different viewpoints. The arrows on the X and
Y axes indicate increasing X and Y values.