Appearance of Non-grouped Data
When you use statements such
as SERIESPLOT, BANDPLOT, NEEDLEPLOT, ELLIPSE, STEPPLOT, FRINGEPLOT,
LINEPARM, and VECTORPLOT to draw plots containing lines, the same
style element, GraphDataDefault, is used for all line and marker
properties. You can think of these plots as "non-specialized," and
they all have the same default appearance when used in overlays
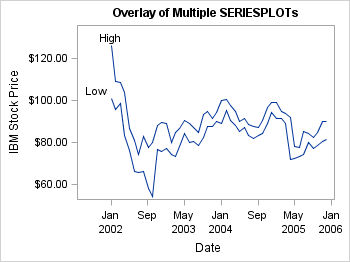
In the graph that is
produced by the following code, the series lines have the same default
appearance.
proc template;
  define statgraph series;
    begingraph;
      entrytitle "Overlay of Multiple SERIESPLOTs";
      layout overlay / yaxisopts=(label="IBM Stock Price");
        seriesplot x=date y=high / curvelabel="High";
        seriesplot x=date y=low /  curvelabel="Low";
      endlayout;
    endgraph;
  end;
run;

proc sgrender data=sashelp.stocks template=series;
   where date between "1jan2002"d and "31dec2005"d
         and stock="IBM";
run;
To ensure that the series
lines differ in appearance, you can use any style element with line
properties. A set of carefully constructed style elements named GraphData1
to GraphDataN (where N=12 for most styles, some styles might have
fewer) are normally used for this purpose. These elements all use
different marker symbols, line pattern, fill colors (COLOR=) and line
and marker colors (CONTRASTCOLOR=). All line and marker colors are
of different hues but with the same brightness, which means that all
twelve colors can be distinguished but none stands out more than another.
Fill colors are based on the same hue but have less saturation, making
them similar but more muted than the corresponding contrast colors.
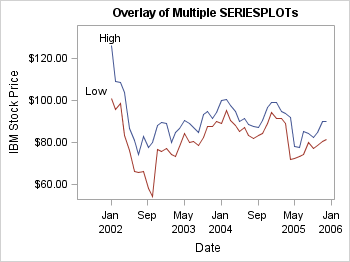
In the following template
code, the style elements GraphData1 and GraphData2 are used to change
the default appearance of the series lines in the graph.
layout overlay / yaxisopts=(label="IBM Stock Price");
  seriesplot x=date y=high / curvelabel="High" lineattrs=GraphData1 ;
  seriesplot x=date y=low /  curvelabel="Low"  lineattrs=GraphData2 ;
endlayout;
Note: This same graph could also
have been achieved by specifying CYCLEATTRS=TRUE on the LAYOUT OVERLAY
statement and omitting the LINEATTRS= options on the plot statements.
By default, the GraphDataN
style elements can be used interchangeably to achieve visual distinction.
All of these elements vary color, line pattern, and marker symbols
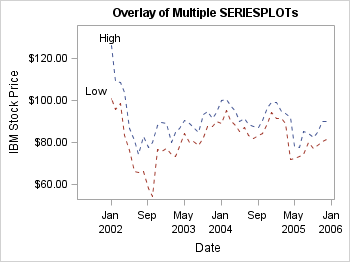
to gain maximum differentiation. Sometimes, you might not want to
vary all properties at once. For example, to force only the color
to change but not the line pattern, you can override one or more properties
that you want to hold constant.
layout overlay / yaxisopts=(label="IBM Stock Price");
  seriesplot x=date y=high / curvelabel="High"
    lineattrs=GraphData1(pattern=shortdash) ;
  seriesplot x=date y=low / curvelabel="Low"
    lineattrs=GraphData2(pattern=shortdash) ;
endlayout;
Other statements such
as DENSITYPLOT, REGRESSIONPLOT, LOESSPLOT, PBSPLINEPLOT, MODELBAND,
REFERENCELINE, and DROPLINE are "specialized" in the sense that their
default line appearance is governed by other style elements such as
GraphFit, GraphConfidence, GraphPrediction, GraphReference, or some
other specialized style element. When these statements are used in
conjunction with the "non-specialized" plot statements, there are
differences in appearance.