Features of Discrete Legends
Ordering the Legend Entries for a Grouped Plot
Overivew
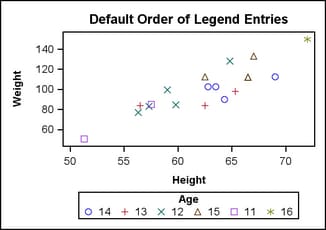
When the
GROUP=column option is used
with a plot, the unique values of column are presented in the legend in the order that they occur in the
data.
proc template;
 define statgraph order;
  dynamic TITLE;
  begingraph;
   entrytitle TITLE;
   layout overlay;
    scatterplot x=height y=weight / name="sp"
      group=age ;
    discretelegend "sp" / title="Age";
   endlayout;
  endgraph;
 end;
run;

proc sgrender data=sashelp.class template=order;
  dynamic
    title="Default Order of Legend Entries";
run;
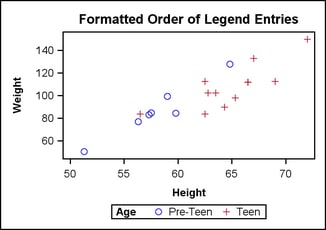
Formatting the Data
You can
apply a format to a group column to change the legend entry labels
or the number of classification levels. The ordering of the legend
entries is based on the order of the pre-formatted group values.
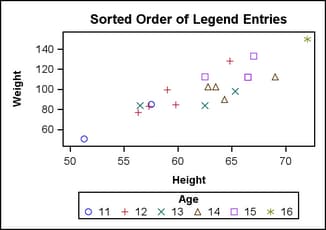
In the following example, the data is sorted in ascending order, so
the legend entry order is "Pre-Teen" "Teen" "Adult" (there are no
adults, so "Adult" does not appear in the graph). If the data were
sorted in descending age order the legend entry order would be reversed.
proc format;
  value teenfmt
  low-12  = "Pre-Teen"
  13-19   = "Teen"
  20-high = "Adult";
run;

proc sort data=sashelp.class out=class;
  by age;
run;

proc sgrender data=class template=order;
  format age teenfmt.;
  dynamic
    title="Formatted Order of Legend Entries";
run;
In a GTL template, the
plot statement, not the legend statement, defines the association
of grouped data values with colors, symbols, and line patterns. The
association is simply reflected in the legend entries. To change the
mapping between grouped data values and the associated style elements,
use the INDEX=column option
on the plot statement. For a discussion of the INDEX= option, see Managing Graph Appearance: General Principles.
Ordering the Legend Entries for Non-grouped Plots
Varying Visual Properties
In the
following examples, the CYCLEATTRS=TRUE setting is used as a quick
way to change the visual properties of each plot without explicitly
setting it. When CYCLEATTRS=TRUE, any plots that derive their default
visual properties from one of the GraphData elements are cycled through
those elements for deriving visual properties. So, the first plot
gets its visual properties from the GraphData1 style element, the
next plot gets its properties from the GraphData2 style element, and
so on. When plot lines represent entities such as fit lines or confidence
bands, it is recommended that you use options such as LINEATTRS= or
OUTLINEATTRS= and specify appropriate style elements. For example,
you might specify
LINEATTRS=GraphFit or OUTLINEATTRS=GraphConfidence.
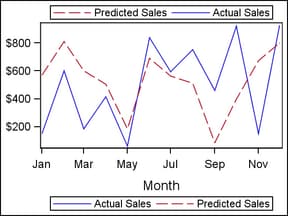
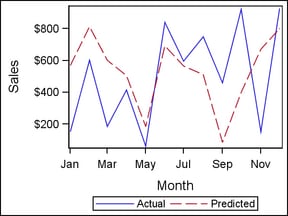
Assigning Legend Entry Labels
Every
GTL plot type (except box plot) has a default legend entry label.
For example, for some X-Y plots, the default entry legend label is
the label of the Y= column (or the column name if no label is assigned).
To assign a legend entry
label for a plot, you can use a LABEL statement with PROC SGRENDER,
or use the LEGENDLABEL="string" option on the plot statement.
layout overlay / yaxisopts=(label="Sales")
                 cycleattrs=true;
  seriesplot x=month y=actual / name="a"
             legendlabel="Actual" ;
  seriesplot x=month y=predict / name="p"
             legendlabel="Predicted" ;

  discretelegend "a" "p"/  valign=bottom;
endlayout;
Note: Other techniques
are available for labeling plots without using a legend. Plots that
render one or more lines (SERIESPLOT, STEPPLOT, DENSITYPLOT, REGRESSIONPLOT,
LOESSPLOT, PBSPLINEPLOT, MODELBAND, BANDPLOT, LINEPARM, REFERENCELINE,
and DROPLINE) all support a CURVELABEL= option that places text inside
or outside of the plot wall to label the line(s). Additional options
are available to control curve label location, position, and text
properties. For examples, see Managing Graph Appearance: General Principles and Adding and Changing Text in a Graph.
Arranging Legend Entries into Columns and Rows
Overview
When legends
have many entries or the legend value labels are long, you might want
to control how the legend entries are organized. The following examples
show how the size of the graph can affect the default legend organization.
Legend Wrapping
As the
graph gets smaller, the area that is allotted to the legend is reduced.
In the following graph, the width of the graph is reduced to the point
where it causes the legend entries to wrap into an additional row.
Because the legend needs this extra row, the height of the plot wall
must be reduced, leaving less room for the data display. Also, because
the legend entries and title do not fit in one row, the title is now
drawn above the legend entries.
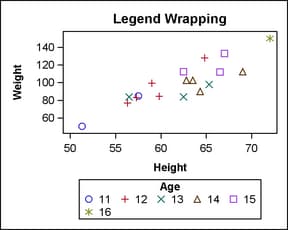
Options to Control Legend Wrapping
Organizing Legend Entries in a Fixed Number of Columns
For legends
with left or right horizontal alignment, a vertical orientation of
legend entries works best because it allows the most space for the
plot area. In such cases, you typically want to set a small fixed
number of columns for the legend entries and let the entries wrap
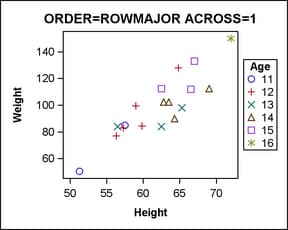
to a new row whenever necessary. This entails setting ORDER=ROWMAJOR
and an ACROSS= value. In the following example, ACROSS=1 means "place
all entries in one column, and start as many new rows as necessary."
layout overlay;
  scatterplot x=Height y=Weight / name="sp"
    group=age;
  discretelegend "sp" / title="Age"
    halign=right valign=center
    order=rowmajor across=1 ;
endlayout;
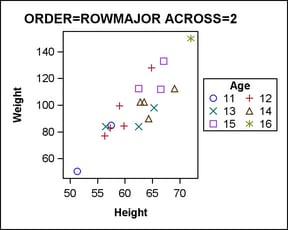
As you
increase the number of columns, the plot area decreases. In the following
example, ACROSS=2 means "place all entries in two columns left to
right, and start as many new rows as necessary."
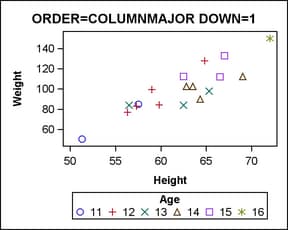
Organizing Legend Entries in a Fixed Number of Rows
For legends
with a top and bottom alignment, a horizontal orientation of legend
entries works best. In such cases, you typically want to set a small
fixed number of rows for the legend entries and let the entries wrap
to a new column whenever necessary. This entails setting ORDER=COLUMNMAJOR
and a DOWN= value. In the following example, DOWN=1 means "place all
entries in one row, and start as many new columns as necessary."
layout overlay;
  scatterplot x=Height y=Weight / name="sp"
    group=age;
  discretelegend "sp" / title="Age"
    order=columnmajor down=1 ;
endlayout;
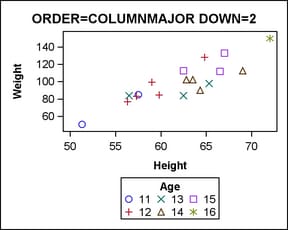
As you
increase the number of rows, the plot area decreases. In the following
example, DOWN=2 means "place all entries in two rows top to bottom,
and start as many new columns as necessary."
When Discrete Legends Get Too Large
As a discrete
legend gets more entries or as the legend entry text is lengthy, the
legend grows and the plot wall shrinks to accommodate the legend's
size. At some point, the plot wall becomes so small that it is useless.
For that reason, whenever all the legends in a graph occupy more than
20% of the total area of the graph, the larger legends are dropped
as needed from the graph to keep the legend area at 20% or less of
the graph area. For example, the following code generates only one
legend, but that legend would occupy more than 20% of the total area
of the graph, so the legend is dropped and the plot is rendered as
if no legend were specified.
proc template;
 define statgraph legendsize;
  begingraph;
    entrytitle "Legend Drops out with GROUP=NAME";
    layout overlay;
      scatterplot x=Height y=Weight / name="sp" group=name;
      discretelegend "sp" / title="Name" across=2 halign=right;
    endlayout;
  endgraph;
 end;
run;

proc sort data=sashelp.class out=class; by name; run;

proc sgrender data=class template=legendsize;
run;
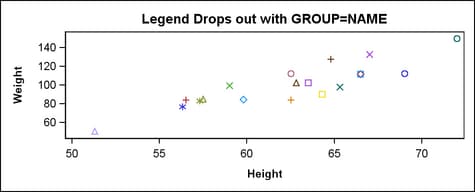
NOTE: Some graph legends have been dropped due to size constraints. Try adjusting
      the MAXLEGENDAREA=, WIDTH= and HEIGHT= options in the ODS GRAPHICS
      statement.
In such cases, you can use the WIDTH= and HEIGHT= options
in the ODS GRAPHICS statement to increase the graph area so that at
some point the legend is displayed.
Another alternative is to use the MAXLEGENDAREA=
option to change the threshold area for when legends drop out. The
following specification allows all legends to occupy up to 40% of
the graph area:
ods graphics / maxlegendarea=40;
proc sgrender data=class template=legendsize;
run;
However,
changing the total area that is allotted to legends might not resolve
the problem if the specified legend organization does not fit in the
existing size. In these cases, the legend might not be displayed and
you would see the following log message:
WARNING: DISCRETELEGEND statement with DISPLAYCLIPPED=FALSE is getting clipped.
         The legend will not be drawn.
To investigate this problem, you
can specify DISPLAYCLIPPED=TRUE in the DISCRETELEGEND statement, which
forces the legend to display so that you can visually inspect it.
discretelegend "sp" / title="Name" across=2 halign=right displayclipped=true ;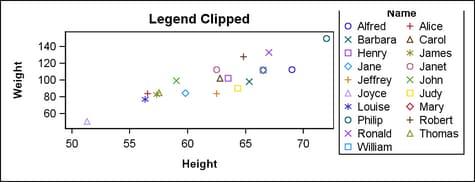
In the
current example, it is apparent that the height chosen for the output
is not large enough to display the title and all legend entries in
two columns. The problem can be fixed in any of the following ways:
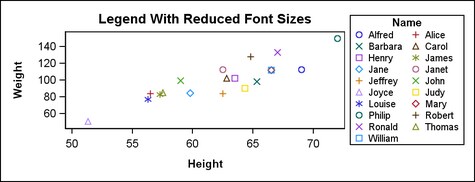
To change the font sizes of the legend entries, use the
VALUEATTRS= option on the legend statement. To change the font size
of the legend title, use the TITLEATTRS= option. Normally, the legend
entries are displayed in 9pt font, and the legend title is displayed
in 10pt font. The following example reduces the size of legend text: