SG Annotation Data Sets
About the SG Annotation Data Set
Once you have determined
which annotation you want and how you want it to appear in the output,
you can create the SG annotation data set. This data set contains
the commands for creating one or more annotation elements. The annotations
drawn by these commands can be added to SG procedure output.
Each observation represents
a command to draw an annotation element or to continue an element.
Reserved keywords are used for functions that specify the drawing
operation.
You create the data
set using the same methods that you use to create any SAS data set.
The main distinctions are that the SG annotation data set uses reserved
keywords for its variable names, and each observation represents a
command to draw an annotation element.
Note: The most commonly
used method for creating data sets is with a DATA step. For more information
about the DATA step, see SAS Language Reference: Concepts.
Here is an example
of an SG annotation data set named LINE. The observations in this
data set contain the commands that create a blue text label and a
blue line.
LINE SG Annotation Data Set
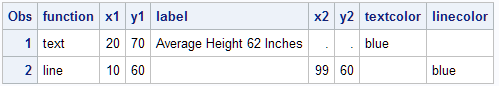
A blank denotes a missing
value for a character variable. A '.' denotes a missing value for
a numeric variable.
Each observation in
this data set contains complete instructions for drawing an annotation.
The value of the FUNCTION variable determines what the observation
does. Other variables control how the function is performed.
-
This instruction writes a blue text inset at position (20,70). The value of the FUNCTION variable (TEXT) tells the program what to do. The values of the coordinate variables X1 and Y1 tell where to do it. The value of the attribute variable TEXTCOLOR specifies the color of the text inset.Note: The default drawing space for both observations is the graph area. For more information about drawing spaces, see Controlling the Drawing Space.
-
This instruction draws a blue line that begins at position (10,60) and ends at (99,60). The value of the FUNCTION variable (LINE) tells the program what to do. The values of the coordinate variables X1, Y1, X2, and Y2 tell where to do it. The value of the attribute variable LINECOLOR specifies the color of the line.
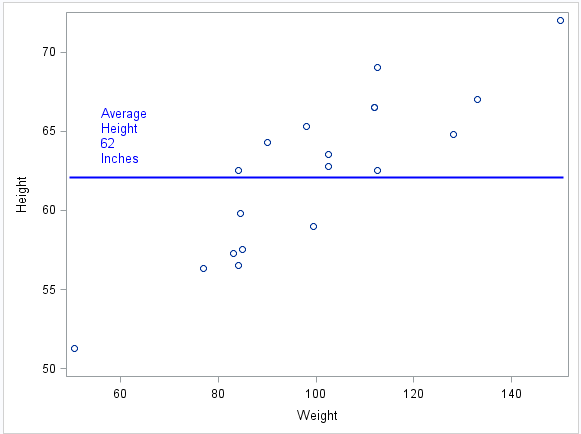
The following figure
shows the blue text and line annotations created by the LINE data
set displayed with an SGPLOT procedure that specifies a scatter plot.
LINE SG Annotation Output
SG Annotation Variables
When an SG annotation
data set is processed, the SG procedure looks at the values of specific
variables in order to draw annotation elements. Variables in the SG
annotation data set have predefined names. In each observation, the
procedure looks only for variables with those names. Other variables
can be present, but they are ignored.
-
A FUNCTION variable specifies which annotation element to draw. For more information, see SG Annotation Functions.
-
Coordinate system variables specify the drawing space to use for the annotation. For more information, see Controlling the Drawing Space.
All variables
are described in the context of the functions that support the variables.
For more information about the functions, see SG Annotation Function Dictionary.
SG Annotation Functions
In an SG annotation
data set, the FUNCTION variable accepts a set of predefined values
(functions) that insert annotation elements into the graph. The value
of the FUNCTION variable specifies what drawing action the observation
performs. These functions act in conjunction with other variables
that determine where and how to perform the action.
Summary of SG Annotation Functions
|
Draws an arrow annotation. For more information,
see ARROW Function.
|
|
|
Specifies a graphic
file to use for an image annotation. For more information,
see IMAGE Function.
|
|
|
Draws a line annotation. For more information,
see LINE Function.
|
|
|
Draws an oval or circle
annotation. For
more information, see OVAL Function.
|
|
|
Continues drawing a
polygon that was begun with the POLYGON function, or a line that was
begun with the POLYLINE function. For more information,
see POLYCONT Function.
|
|
|
Specifies the beginning
point of a polygon. For more information, see POLYGON Function.
|
|
|
Specifies the beginning
point of a polyline, which is a connected series of line segments. For more information,
see POLYLINE Function.
|
|
|
Draws a rectangle or
square annotation. For more information, see RECTANGLE Function.
|
|
|
Places text in the graph
output. For
more information, see TEXT Function.
|
|
|
Continues a text string. For more information,
see TEXTCONT Function.
|