Example Program and Statement Details
Statement Summary
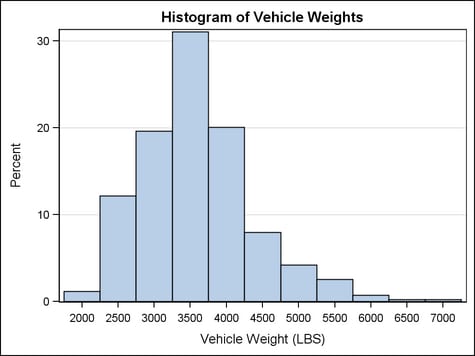
The histogram’s
default bin width is computed by using the number of observations
and the range of the data. When a curve is overlaid on the histogram,
the histogram’s bin width is used to scale the curve so that
the area under the curve is equal to the area of the histogram. By
default, the X and Y axes of the histogram are linear. You can use
the XAXISOPTS= and YAXISOPTS= options on the LAYOUT OVERLAY statement
to change the axes properties.
Options
Specifies whether to
use bins as the basis for axis tick marks.
Interaction: When
this option is set to TRUE, some X-axis options that are set on the
parent layout might not apply.
Interaction: This
option is ignored if this HISTOGRAM is not the primary plot (for more
information about primary plots, see When Plots Share Data and a Common Axis).
specifies the X coordinate
of the first bin. Use this option in conjunction with the BINWIDTH= or NBINS= options to specify bins. If neither
BINWIDTH= nor the NBINS= option is specified, the system determines
the number of bins. If the BINSTART value results in excluding the
entire range of data, it is ignored and the default BINSTART value
is used.
specifies the bin width.
The system determines the number of bins. The bins always span the
range of the data.
specifies the degree
of the transparency of the bar fills and bar outlines.
Tip: The FILLATTRS= option can be used to set transparency
for just the bar fills. You can combine this option with FILLATTRS=
to set one transparency for the bar outlines but a different transparency
for the bar fills. Example:
datatransparency=0.2 fillattrs=(transparency=0.6)
specifies whether to
display outlined bars, filled bars, or outlined and filled bars.
a list of comma-separated
options enclosed in parentheses. Any of the options from the OUTLINEATTRS= and FILLATTRS= options can be used. The specified
list must include one of the following:
| OUTLINE | displays outlined bars |
| FILL | displays filled bars |
specifies whether the
axis ticks and value labels are drawn at the bin endpoints or at the
bin midpoints.
| TRUE | draws the axis ticks and value labels at the bin endpoints |
| FALSE | draws the axis ticks and value labels at the bin midpoints |
Interaction: If BINAXIS=FALSE or this HISTOGRAM is not the primary plot, then this
option is ignored.
specifies the appearance
of the interior fill area of the bars. See General Syntax for Attribute Options for the syntax
on using a style-element and Fill Options for available fill-options.
Interaction: For
this option to have any effect, the fill must be enabled by the ODS
style or the DISPLAY= option.
Tip: The DATATRANSPARENCY= option sets the transparency for
bar fills and bar outlines. You can combine this option with DATATRANSPARENCY=
to set one transparency for the outlines but a different transparency
for the fills. Example:
datatransparency=0.2 fillattrs=(transparency=0.6)
specifies a column
that indicates a frequency count for each observation of the input
data object. If n is the value
of the FREQ variable for a given observation, then that observation
is plotted n times.
specifies the number
of bins. The system determines the BINWIDTH= value. The bins always span the range of the data.
specifies the line
properties of the bar outlines. See General Syntax for Attribute Options for the syntax
on using a style-element and Line Options for available line-options.
Interaction: For
this option to have any effect, the outlines must be enabled by the
ODS style or the DISPLAY= option.
specifies that the
data columns for this plot be used for determining default axis features.
Details: This
option is needed only when two or more plots within an overlay-type
layout contribute to a common axis. For more information, see When Plots Share Data and a Common Axis.
specifies whether data
are mapped to the primary X (bottom) axis or to the secondary X2 (top)
axis.
Interaction: The
overall plot specification and the layout type determine the axis
display. For more information, see How Axis Features Are Determined.
specifies whether the
X values represent lower endpoints, midpoints, or upper endpoints
of the bins. For example, if BINSTART=10 and BINWIDTH=10, using LEFTPOINTS
would result in bins 10 - 20, 20 - 30, and so on. Using RIGHTPOINTS
would result in bins 0 - 10, 10 - 20, ...., and using MIDPOINTS would
result in bins 5 - 15, 15 - 25, ... .
specifies whether data
are mapped to the primary Y (left) axis or to the secondary Y2 (right)
axis.
Interaction: The
overall plot specification and the layout type determine the axis
display. For more information, see How Axis Features Are Determined.