Example Program and Statement Details

Example Graph

The following graph was generated by the Example Program:
Example Mosaic Plot Graph

Example Program

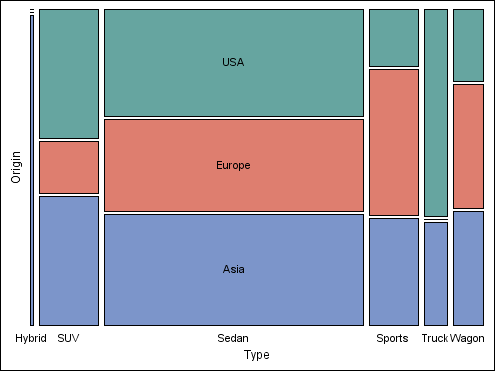
/* Summarize the SASHELP.CARS data for ORIGIN and TYPE */
proc summary data=sashelp.cars nway;
  class origin type;
  var mpg_highway;
  output out=mileage mean=avgMpg N=count / noinherit;
run;

/* Generate the plot */
proc template;
  define statgraph mosaicPlotParm;
    begingraph;
      layout region;
       mosaicPlotParm category=(type origin) count=count /
          colorgroup=origin;
      endlayout;
    endgraph;
  end;
run;

proc sgrender data=mileage template=mosaicPlotParm;
run;

Statement Summary

A mosaic plot is used to display relative frequencies for categorical variables. Each crossing of the categorical values is represented by a tile. The area of each tile is proportional to the frequency of that crossing. The graph 
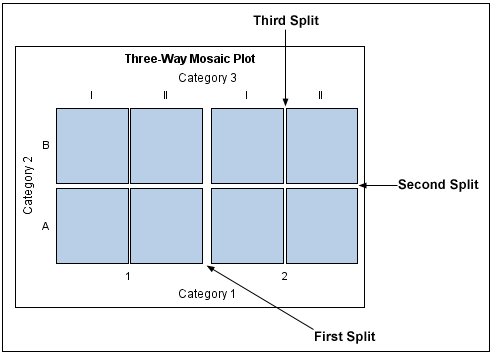
is the result of an iterative process. The first iteration splits the plot area into tiles along the width according to the relative frequency of the first category column values. Subsequent iterations split the tiles from the previous iteration in the direction orthogonal to the previous split using the relative frequencies of each category column's values. By default, the gap (or gutter) for each split gets progressively smaller down to a minimum gap of 3 pixels. You can use the GUTTER= option to specify a different gap for each split.
The following figure provides an example for a three-way mosaic plot, which has three categories.
Three-Way Mosaic Plot
Note: The plot contains equal-sized tiles for demonstration purposes.
In the example plot, the first split is along the width for CATEGORY 1. The second split is along the height for CATEGORY 2. Finally, the third split is along the width for CATEGORY 3. Notice how the gaps between the tiles get progressively smaller from the first split to the last split.
Note: The MOSAICPLOTPARM statement can be use in GRIDDED, LATTICE, and REGION layouts only.

Required Arguments

CATEGORY=(column-list)
specifies a list of columns of category (classification) values.
Restriction: No more than three columns can be specified.
COUNT=non-negative-numeric-column | expression
specifies the column of counts (pre-summarized) for each of the category value combinations.
Restriction: The column values cannot be negative.
Tip: You need to provide the category crossings with nonzero counts only.

Options

Statement Option
Description
Specifies the category column to use for discrete fill colors for the tiles.
Specifies the name of the color model in the style that is used by the COLORRESPONSE= option.
Specifies a numeric column for a continuous gradient value to tile color mapping.
Specifies the degree of the transparency of the tile fill, outlines, and (inside) values.
Specifies the plot features to display.
Specifies the appearance of the tile fill.
Specifies the size of the gutter (gap) between the splits.
Specifies the text attributes of the category values when located inside a tile.
Specifies the text attributes of the category column labels.
Specifies a label to be used in a legend.
Assigns a name to a plot statement for reference in other template statements.
Specifies the properties of tile outlines.
Specifies whether to reverse a gradient defined by the COLORMODEL= option.
Specifies user-defined roles for information contained in data columns.
Specifies that a square aspect ratio be used for the plot area.
Specifies the information to display when the cursor is positioned over a tile.
Specifies display formats for information defined by roles.
Specifies display labels for information defined by roles.
Specifies the text attributes of the category column values when located outside a tile.
Specifies the location of the category column values for a two-way plot.
Specifies the fit policy for outside category values along the height of the plot.
Specifies the fit policy for outside category values along the width of the plot.
COLORGROUP=column | discrete-attr-var
specifies the category column to use for discrete fill colors for the tiles. Each unique value of this column is mapped to the COLOR attribute of the GraphData1–GraphDataN style elements that are in effect. If a discrete attribute variable is specified, the color mapping from its associated DISCRETEATTRMAP statement is used.
discrete-attr-var
specifies a discrete attribute variable that is defined in a DISCRETEATTRVAR statement.
Restriction: A discrete attribute variable specification must be a direct reference to the attribute variable. It cannot be set by a dynamic variable.
Default: no default
Restriction: This column or the associated column in the discrete attribute variable must be one of the columns in the category column list.
Interaction: This option is ignored if the COLORRESPONSE= option is specified.
Interaction: This option overrides the FILLATTRS= option.
COLORMODEL=style-element
specifies a style element to be used with the COLORRESPONSE= option. The style element should contain the following style attributes:
STARTCOLOR The color for the smallest value of the COLORRESPONSE= variable.
NEUTRALCOLOR The color for the midpoint of the range of the COLORRESPONSE= variable.
ENDCOLOR The color for the highest value of the COLORRESPONSE= variable.
Default: The ThreeColorRamp style element.
Interaction: The REVERSECOLORMODEL= option reverses the order of the colors that are assigned in the ramp.
Interaction: The COLORRESPONSE= option must be in effect for this option to have any effect.
COLORRESPONSE=numeric-column | range-attr-var | expression
specifies a numeric column that is used to map tile fill colors to a continuous gradient. The range of values of this column are linearly mapped to the color ramp that is specified by the COLORMODEL= option. When a range attribute variable is used, the color ramp from the RANGEATTRVAR statement that is associated with the range attribute variable is used instead.
range-attr-var
specifies a range attribute variable that is defined in a RANGEATTRVAR statement.
Restriction: A reference to a range attribute variable must be a direct reference to the attribute variable. It cannot be set as a dynamic variable.
Default: no default
DATATRANSPARENCY=number
specifies the degree of the transparency of the tile fill, outlines, and the values that are located inside of the tiles, if displayed.
Default: 0
Range: 0 (opaque) to 1 (entirely transparent)
DISPLAY=STANDARD | ALL | (display-options)
specifies which graphical features to display in the plot.
STANDARD
displays tiles with fills, outlines, labels, and values.
ALL
same as STANDARD.
display-options
a list of one or more of the following options enclosed in parenthesis:
FILL Displays filled tiles.
OUTLINE Displays the tile outline.
LABELS Displays the category column labels.
TICKS Displays the category ticks.
VALUES Displays the category values.
Default: STANDARD
Interaction: If neither FILL nor OUTLINE are present in the display-options list, then filled and outlined tiles are displayed.
Interaction: If YVALUELOCATION=INSIDE or if YVALUELOCATION=AUTO and it effectively sets it to INSIDE, then the axis ticks are not displayed even if the display of the ticks is specified for the axis. See YVALUELOCATION=.
FILLATTRS=style-element | (fill-options)
specifies the appearance of the tile fill areas. See General Syntax for Attribute Options for the syntax on using a style-element and Fill Options for available fill-options.
Default: The GraphDataDefault style element
Note: When style-element is specified, only the style element’s COLOR attribute is used.
GUTTER=dimension | (dimension-list)
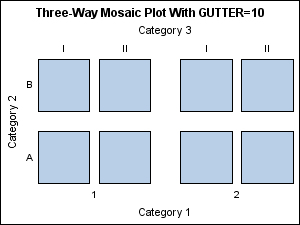
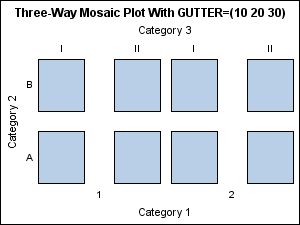
specifies the gutter (gap) between splits as follows:
  • When a single dimension is used, it applies to the gap for the last split, which has the smallest gap. From the next-to-last last split to the first split, the gutter is doubled on each split. A single dimension has the effect of setting a minimum gap for the plot. The following figure shows an example where GUTTER=10.
    Three-Way Mosaic Plot With 10-Pixel Gutter
    Note: The plot contains equal-sized tiles for demonstration purposes.
    In this case, the gaps are 30 pixels for the first split, 20 pixels for the second split, and 10 pixels for the third split (minimum gap).
  • When a list of dimension values is used, the values apply to each split in the order in which they are specified. The following figure shows an example where GUTTER=(10 20 30).
    Three-Way Mosaic Plot With 10, 20, and 30-Pixel Gutters
    In this case, the gaps are 10 pixels for the first split, 20 pixels for the second split, and 30 pixels for the third split.
Default: 3px. Dimensions with no units are assumed to be in pixels.
INSIDEVALUEATTRS=style-element | style-element (text-options) | (text-options)
specifies the color and font attributes of the category values when they are located inside a tile. See General Syntax for Attribute Options for the syntax on using a style-element and Text Options for available text-options.
Default: The GraphValueText style element.
Interaction: If one or more text options are specified and they do not include all the font properties such as color, family, size, weight, and style, the non-specified properties are derived from the GraphValueText style element.
Note: When style-element is specified, only the element’s COLOR, FONTFAMILY, FONTSIZE, FONTSTYLE, and FONTWEIGHT attributes are used.
Tip: You can use VALUEATTRS= option to change the text attributes for the values that are located outside the plot area.
LABELATTRS=style-element | style-element (text-options) | (text-options)
specifies the color and font attributes of the category labels. See General Syntax for Attribute Options for the syntax on using a style-element and Text Options for available text-options.
Default: The GraphLabelText style element.
Interaction: If one or more text options are specified and they do not include all the font properties such as color, family, size, weight, and style, the non-specified properties are derived from the GraphLabelText style element.
Note: When style-element is specified, only the style element’s COLOR, FONTFAMILY, FONTSIZE, FONTSTYLE, and FONTWEIGHT attributes are used.
LEGENDLABEL= "string"
specifies a label for this plot to be used in a discrete legend.
Default: The value specified by the NAME= option or no label if the NAME= option is not set.
Interaction: If the COLORGROUP= option is in effect, this option is ignored.
NAME= "string"
assigns a name to a plot statement for reference in other template statements.
Restriction: The string specified by the NAME= option must be unique within the template.
Tip: The NAME= option is used mostly with the CONTINUOUSLEGEND and DISCRETELEGEND statements in order to coordinate the use of colors and line patterns between the graph and the legend.
Tip: The string is case sensitive.
OUTLINEATTRS=style-element | (line-options)
specifies the appearance of the tile outlines. See General Syntax for Attribute Options for the syntax on using a style-element and Line Options for available line-options.
Default: The GraphOutlines style element.
Note: When style-element is used, only the style element’s CONTRASTCOLOR, LINESTYLE, and LINETHICKNESS are used.
REVERSECOLORMODEL=boolean
specifies whether to reverse the gradient (color ramp) defined by either the ODS style that is in effect or by the COLORMODEL= option.
Default: FALSE
ROLENAME= (role-name-list)
specifies user-defined roles for information contained in data columns. The role name list is a blank-separated list of rolename = column pairs.
Default: No user-defined roles.
Requirement: The role names that you choose must be unique and different from the predefined roles CATEGORY1 - CATEGORYn in the order in which they are specified in the category column-list, COUNT, COLORGROUP, and COLORRESPONSE.
Interaction: This option affects the data columns that appear in tooltips. See TIP=.
The following example specifies a role for the OBS column:
ROLENAME=(TIP1=OBS)
SQUARED=boolean
specifies that a square aspect ratio be used for the plot area.
Default: FALSE
Restriction: This option applies to multi-way plots only.
Tip: Setting this option to TRUE makes the height of the plot the same as its width, which can make it easier to compare the proportions.
TIP=(role-list)
specifies the information to display when the cursor is positioned over a tile. If this option is used, it replaces all the information displayed by default. Roles for columns that do not contribute to the plot can be specified along with roles that do.
(role-list)
an ordered, blank-separated list of unique MOSAICPLOTPARM and user-defined roles. The MOSAICPLOTPARM roles include COUNT, COLORGROUP, and COLORRESPONSE. User-defined roles are defined with the ROLENAME= option.
The following example displays tooltips for the columns that are assigned to the roles X and Y as well as the user-defined role TIP1:
ROLENAME=(TIP1=OBS) 
TIP=(TIP1 X Y) 
Default: The columns assigned to the category columns and COUNT roles are automatically included in the tooltip information.
Requirement: To generate tooltips, you must include an ODS GRAPHICS ON statement that has the IMAGEMAP option specified, and write the graphs to the ODS HTML destination.
Interaction: The labels and formats for the TIP variables can be controlled with the TIPLABEL= and TIPFORMAT= options.
TIPFORMAT=(role-format-list)
specifies display formats for tip columns.
(role-format-list)
a list of role-name = format pairs separated by blanks.
The following example specifies a format for the X and Y roles:
TIP=(X Y) 
TIPFORMAT=(X=5.3 Y=5.3) 
Default: The column format of the variable assigned to the role or BEST6. if no format is assigned to a numeric column.
Requirement: This option provides a way to control the formats of columns that appear in tooltips. Only the roles that appear in the TIP= option are used. Columns must be assigned to the roles for this option to have any effect. See ROLENAME=.
TIPLABEL= (role-label-list)
specifies display labels for tip columns.
(role-label-list)
a list of role-name = "string" pairs separated by blanks.
The following example specifies labels for the X role and the user-defined TIP1 role:
ROLENAME=(TIP1=PCT)
TIP=(TIP1 X Y)
TIPLABEL=(TIP1="Percent" X="Independent")
Default: The column label or column name of the variable assigned to the role.
Requirement: This option provides a way to control the labels of columns that appear in tooltips. Only the roles that appear in the TIP= option are used. Columns must be assigned to the roles for this option to have any effect. See ROLENAME=.
URL=character-column
specifies the URL of an HTML page to display when a tile is selected.
Default: no default
character-column
each value of the column should be a valid HTML page reference (HREF). For example: http://www.sas.com/technologies/analytics/index.html.
Requirement: To generate selectable tiles, you must include an ODS GRAPHICS ON statement that has the IMAGEMAP option specified, and write the graphs to the ODS HTML destination.
Tip: The URL value can be blank for some tiles, which means that no action is taken when those tiles are selected. The URL value can be the same for different tiles, which means that the same action is taken when those tiles are selected.
VALUEATTRS=style-element | style-element (text-options) | (text-options)
specifies the color and font attributes of the category values that are located outside of the tiles. See General Syntax for Attribute Options for the syntax on using a style-element and Text Options for available text-options.
Default: The GraphValueText style element.
Interaction: If one or more text options are specified and they do not include all the font properties such as color, family, size, weight, and style, the non-specified properties are derived from the GraphValueText style element.
Note: When style-element is used, only the style element’s COLOR, FONTFAMILY, FONTSIZE, FONTSTYLE, and FONTWEIGHT attributes are used.
Tip: You can use INSIDEVALUEATTRS= to change text attributes for values that are located inside of tiles.
VALUELOCATION=AUTO | INSIDE | OUTSIDE
specifies the location of the category column values in a two-way plot.
AUTO
the values for the second category in the CATEGORY= list are located outside of the tiles. If the first category in the CATEGORY= list has any missing crossings with the second category, or if any of the second category values collide, the values are located inside the tiles per the default fit policy. See CATEGORY=.
INSIDE
the values are located inside of the largest tile for each category value.
OUTSIDE
the values are located outside the tiles in the plot area.
Default: AUTO
Restriction: This option applies to two-way plots only.
XVALUEFITPOLICY=ROTATE | NONE
specifies a policy for avoiding collisions among outside category values along the width of the plot.
ROTATE
rotates the values if any of the values collide.
NONE
does not attempt to fit values that collide.
Default: ROTATE
YVALUEFITPOLICY=NONE | ROTATEALWAYS
specifies a policy for avoiding collisions among outside category values along the height of the plot.
NONE
does not attempt to fit values that collide.
ROTATEALWAYS
rotate the values regardless of whether any of the values collide.
Default: NONE
Interaction: This option is effective only when VALUELOCATION=OUTSIDE.