Example Program and Statement Details
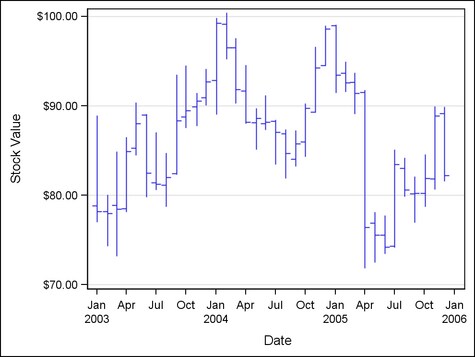
Example Program 1
proc template;
define statgraph highlow;
  begingraph;
    layout overlay /
        yaxisopts=(griddisplay=on label="Stock Value");
      highlowplot x=date high=high low=low /
        open=open close=close;
    endlayout;
  endgraph;
end;

proc sgrender data=sashelp.stocks template=highlow;
  where date >= '01JAN03'd and stock="IBM";
run;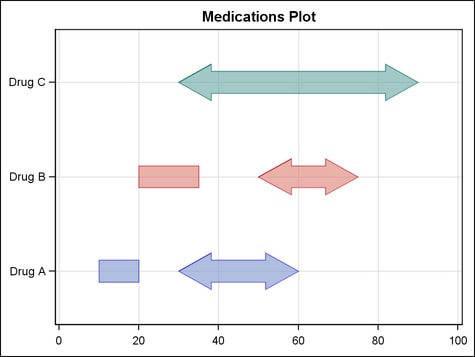
Example Program 2
data highlowbar;
  length cap $ 12;
  input drug $ 1-10 low high cap $;
  datalines;
Drug A    10   20  NONE
Drug A    30   60  FILLEDARROW
Drug B    20   35  NONE
Drug B    50   75  FILLEDARROW
Drug C    30   90  FILLEDARROW
;
proc template;
define statgraph highlowbar;
  begingraph;
    entrytitle 'Medications Plot';
    layout overlay /
      xaxisopts=(
        griddisplay=on
        linearopts=(viewmin=0 viewmax=100)
        display=(line ticks tickvalues))
      yaxisopts=(
        griddisplay=on
        display=(line ticks tickvalues));
      highlowplot y=drug high=high low=low /
        group=drug outlineattrs=(pattern=solid)
        datatransparency=0.4
        type=bar barwidth=0.4
        highcap=cap lowcap=cap;
    endlayout;
  endgraph;
end;

proc sgrender data=highlowbar template=highlowbar;
run;
Statement Summary
A high-low chart specifies
that floating vertical or horizontal lines or bars connect the minimum
and maximum response values for each value of a categorical variable.
The data should have at least two response values for every category
value. Otherwise, the single value is displayed without the connecting
line or bar. In the statement syntax, the X and Y arguments can specify
a column with character or numeric values. The LOW and HIGH arguments
must specify a numeric column.
The HIGHLOWPLOT statement
can be used to create a graph showing the high and low response values
for observations along a time axis. The independent variable can be
interval or discrete. The HIGHLOWPLOT has two common uses:
-
One typical use of a high-low graph is in the financial industry to plot stock values by day. The OPEN= and CLOSE= options are typically used in the graph, and the TYPE= option is set to LINE (the default), as illustrated in Example Graph 1.
-
Another typical use of a high-low graph is in the Health and Life Sciences industry to display over time the duration of adverse events or of adverse reactions to medication. The HIGHCAP= and LOWCAP= options are typically used in the graph, and the TYPE= option is set to BAR, as illustrated in Example Graph 2.
For both vertical and
horizontal high-low charts, the data values can be grouped using the GROUP= option. For grouped data, the data values are not summarized.
Each observation is plotted independently, and the line or bar segment
for each category value can use different display characteristics.
Arguments
Either the X= or Y=
argument must be specified, but you cannot specify both on the same
HIGHLOWPLOT statement. The HIGH= and LOW= arguments are required.
specifies a column
or expression representing the values in a vertical high-low chart.
The values can be character or numeric.
specifies a column
or expression representing the values in a horizontal high-low chart.
The values can be character or numeric.
Options
specifies the width
of a bar as a ratio of the maximum possible width.
Default:
0.85 of the tick spacing. The bar width automatically adjusts, based
on the number of bars to be displayed and the wall width.
specifies a column
or expressions whose values are used to display a closing-value indicator.
This option is typically used when TYPE=LINE, but it can be used when
TYPE=BAR.
specifies the width
of the group clusters as a fraction of the midpoint spacing on a discrete
axis or a fraction of the minimum interval between adjacent data values
on an interval axis.
Interaction: For
this option to take effect, the GROUP= option must also be specified, and the GROUPDISPLAY= option must be set to CLUSTER.
specifies the degree
of the transparency of the colored regions.
Tip: The FILLATTRS option can be used to set transparency for just the colored
regions. You can combine this option with FILLATTRS= to set one transparency
for the outlines but a different transparency for the region fills
. Example:
datatransparency=0.2 fillattrs=(transparency=0.6)
specifies an amount
to offset all bars or lines from the category midpoints when graphing
multiple response variables side by side on a common axis.
Range: -0.5
to +0.5, where .5 represents half the distance between category
ticks. Normally, a positive offset is to the right for a vertical
plot and up for a horizontal plot. (If the layout's axis options set
REVERSE=TRUE, then the offset direction is also reversed.)
Discussion: This
feature is useful for graphing multiple response variables side by
side on a common axis. By default within an overlay-type layout, if
multiple HIGHLOWPLOT statements are used with different response variables,
the bars or lines for matching category values are centered on the
midpoints and superimposed on each other. In those cases, you can
make it easier to distinguish among superimposed bars or lines by
assigning a different width for them in each HIGHLOWPLOT statement
in the overlay.
If you prefer to avoid
superimposed bars or lines, you can assign a different offset to each
HIGHLOWPLOT statement. If desired, you can adjust the width of the
bar or line in conjunction with DISCRETEOFFSET= to create narrower
bars that require less width within the plot area.
The following example
defines offsets for the lines in a stock report:
layout overlay / cycleattrs=true
    yaxisopts=(label="Stock Value");
  highlowplot x=month high=a_high low=a_low /
    close=a_close open=a_open
    legendlabel="A" name="ahighlow" lineattrs=(pattern=solid)
    discreteoffset=-0.2 ;
  highlowplot x=month high=b_high low=b_low /
    close=b_close open=b_open
    legendlabel="B" name="bhighlow" lineattrs=(pattern=solid)
    discreteoffset=0 ;
  highlowplot x=month high=c_high low=c_low /
    close=c_close open=c_open
    legendlabel="C" name="chighlow" lineattrs=(pattern=solid)
    discreteoffset=+0.2 ;
  discretelegend "ahighlow" "bhighlow" "chighlow" / title="Stock"
    location=inside halign=right valign=top;
endlayout;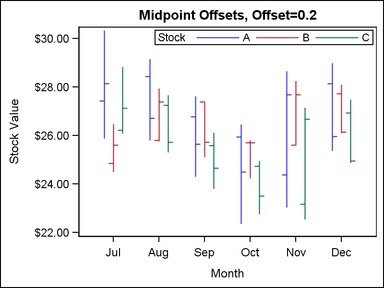
specifies the policy
for displaying end caps, when present.
Note: This feature is
for the second maintenance release of SAS 9.3 and later. See What's New in the SAS 9.3 Graph Template Language.
specifies the appearance
of the interior fill area of the bars. See General Syntax for Attribute Options for the syntax
on using a style-element and Fill Options for available fill-options.
Tip: The DATATRANSPARENCY= option sets the transparency for
the colored regions and the outlines around them. You can combine
this option with DATATRANSPARENCY= to set one transparency for the
outlines but a different transparency for the colored regions. Example:
datatransparency=0.2 fillattrs=(transparency=0.6)
creates a distinct
set of floating bars or lines for each unique group value of the specified
column.
specifies
a discrete attribute variable that is defined in a DISCRETEATTRVAR statement.
-
If fills are enabled by the ODS style or the DISPLAY= option, each distinct group value is represented in the graph by a different fill color. The fill colors are defined by the GraphData1:Color–GraphDataN:Color style references.
-
For floating lines when TYPE=LINE. and for outlines when TYPE=BAR (if outlines are enabled by the ODS style or the DISPLAY= option), each distinct group value is represented in the graph by a different line color and line pattern. The colors and patterns are defined by the ContrastColor and LineStyle attributes of the GraphData1–GraphDataN style elements.
Interaction: If
the X or Y role is discrete, then the bars or lines representing the
group can be drawn in a cluster or overlaid, based on the setting
for the GROUPDISPLAY= option. However, if the X or Y role
is interval, then the lines representing the group are overlaid and
the GROUPDISPLAY= option is ignored.
Interaction: By
default, the group values are mapped in the order of the data. The GROUPORDER= option can be used to control the
sorting order of the grouped bar segments. The INDEX= option can be used to alter the default sequence of colors
and line patterns.
Interaction:
The INCLUDEMISSINGGROUP= option determines whether missing
group values are considered a distinct group value.
Tip:
The representations that are used to identify the groups can be overridden.
For example, if each distinct group value is represented by a different
line pattern, the LINEATTRS= (PATTERN=pattern)
specification can be used to assign the same line pattern to all the
plot lines. In that case, the line color denotes group values. Likewise,
LINEATTRS= (COLOR= color) can
be used to assign the same color to all lines, letting line pattern
denote group values.
specifies whether grouped
bars or lines are overlaid or clustered around the category midpoints.
The following example
shows the effect of clustering the lines in a stock report when the
category values are grouped into a single response variable. Note
that if your category values are not grouped in the same variable
but are stored in separate variables, you can get this same effect
by using the DISCRETEOFFSET= option.
layout overlay /
    yaxisopts=(label="Stock Value");
  highlowplot x=month high=high low=low /
    close=close open=open
    legendlabel="Stock" name="cluster"
    group=stock groupdisplay=cluster
    lineattrs=(pattern=solid);
  discretelegend "cluster" / title="Stock"
    location=inside halign=right valign=top;
endlayout;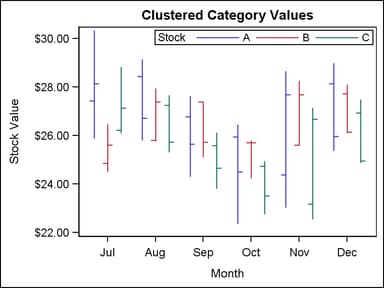
specifies the type
of cap used at the high end of the bar or line. This option is typically
used when TYPE=BAR, but it can be used when TYPE=LINE.
Interaction: All
of the keywords can be specified for any high-low chart, but the effect
of each keyword depends on the setting for the TYPE= option and also the fill state of the bars, when displayed:
specifies whether missing
values of the group variable are included in the plot.
Tip:
Unless a discrete attribute map is in effect or the INDEX= option
is used, the attributes of the missing group value are determined
by the GraphMissing style element except when the MISSING= system
option is used to specify a non-default missing character or when
a user-defined format is applied to the missing group value. In those
cases, the attributes of the missing group value are determined by
a GraphData1–GraphDataN style element.
specifies indices for
mapping color and line patterns to group values.
Restriction: If
the value of the numeric-column is
missing or is less than 1, the observation is not used in the analysis.
If the value is not an integer, only the integer portion is used.
Interaction: All
of the indexes for a specific group value must be the same. Otherwise,
the results are unpredictable.
Interaction: The
index values are 1-based indices. For the style definitions in GraphData1–GraphDataN,
if the index value is greater than N, then a modulo operation remaps
that index value to a number less than N to determine which style
to use.
Interaction: If
this option is not used, then the group values are mapped according
to the setting of the GROUPORDER= option.
Discussion: Indexing
can be used to collapse the number of groups that are represented
in a graph. For more information, see Remapping Groups for Grouped Data.
specifies the color
and font attributes of the labels for the bars or lines. See General Syntax for Attribute Options for the syntax
on using a style-element and Text Options for available text-options.
specifies the attributes
of the floating plot lines. See General Syntax for Attribute Options for the syntax
on using a style-element and Line Options for available line-options.
specifies the type
of cap used at the low end of the bar or line. This option is typically
used when TYPE=BAR, but it can be used when TYPE=LINE.
Interaction: All
of the keywords can be specified for any high-low chart, but the effect
of each keyword depends on the setting for the TYPE= option and also the fill state of the bars, when displayed:
specifies a column
or expressions whose values are used to display an opening-value indicator.
This option is typically used when TYPE=LINE, but it can be used when
TYPE=BAR.
specifies the appearance
of the outlines of the filled regions. See General Syntax for Attribute Options for the syntax
on using a style-element and Line Options for available line-options.
Interaction: For
this option to have any effect, outlines must be enabled by the ODS
style or the DISPLAY= option.
specifies that the
data columns for this plot and the plot type be used for determining
default axis features.
Details: This
option is needed only when two or more plots within an overlay-type
layout contribute to a common axis. For more information, see When Plots Share Data and a Common Axis.
specifies the information
to display when the cursor is positioned over a bar or line. If this
option is used, it replaces all the information displayed by default.
Roles for columns that do not contribute to the bar chart can be specified
along with roles that do.
Default: The
columns assigned to these roles are automatically included in the
tooltip information: X and Y.
an ordered, blank-separated
list of unique HIGHLOWPLOT and user-defined roles. HIGHLOWPLOT roles
include X, Y, LOW, HIGH, OPEN, and CLOSE.
Requirement: To
generate tooltips, you must include an ODS GRAPHICS ON statement that
has the IMAGEMAP option specified, and write the graphs to the ODS
HTML destination.
Interaction: The
labels and formats for the TIP variables can be controlled with the TIPLABEL= and TIPFORMAT= options.
specifies display formats
for information defined by the tooltip roles.
Default: The
column format of the variable assigned to the role or BEST6. if no
format is assigned to a numeric column.
Requirement: This
option provides a way to control the formats of columns that appear
in tooltips. Only the roles that appear in the TIP= option are used. Columns must be assigned to the roles
for this option to have any effect.
specifies display labels
for information defined by the tooltip roles.
Requirement: This
option provides a way to control the labels of columns that appear
in tooltips. Only the roles that appear in the TIP= option are used. Columns must be assigned to the roles
for this option to have any effect.
specifies whether data
are mapped to the primary X (bottom) axis or to the secondary X2 (top)
axis.
Interaction: When
the Y= argument is specified, the HIGH= and LOW= arguments are mapped
to the axis that is specified on this option (X or X2).
Interaction: The
overall plot specification and the layout type determine the axis
display. For more information, see How Axis Features Are Determined.
specifies whether data
are mapped to the primary Y (left) axis or to the secondary Y2 (right)
axis.
Interaction: When
the X= argument is specified, the HIGH= and LOW= arguments are mapped
to the axis that is specified on this option (Y or Y2).
Interaction: The
overall plot specification and the layout type determine the axis
display. For more information, see How Axis Features Are Determined.