Graph Template Language (GTL)
GTL and the Output Delivery System (ODS)
The SAS Graph Template Language (GTL) is an extension
to the Output Delivery System (ODS) that enables you to create sophisticated
graphics. For example, using the GTL, you can generate Model-Fit plots,
Distribution Plots, Comparative plots, Prediction Plots, and more.
The graphics produced
by the GTL are generated by template definitions that control the
graph format and appearance and specify the variable roles to represent
in the graph display. The graphs can then be rendered by associating
the templates with a data source.
-
The GTL templates are defined with PROC TEMPLATE. The GTL includes conditional statements that can be used to determine what graph features are rendered. It also includes layout statements that specify the arrangement of graph features, plot statements that request specific plot types (such as histograms and scatter plots), and text and legend statements that specify titles, footnotes, legends, and other text-based graph elements.
A Quick Example
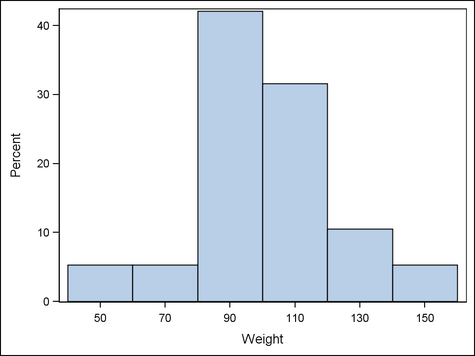
The data set SASHELP.CLASS
is delivered with the SAS System. It includes data columns named HEIGHT
and WEIGHT, which store height and weight measures for a small sample
of subjects. The Graphics Template Language can be used to generate
a histogram that shows the distribution of weight recorded in that
data set:
proc template;
  define statgraph histogram;
    begingraph;
      layout overlay;
        histogram weight;
      endlayout;
    endgraph;
  end;
run;

ods graphics / width=450px;
ods listing;
proc sgrender data=sashelp.class
  template=histogram;
run;-
The LAYOUT OVERLAY statement is one of the most fundamental layout statements. It can overlay the results of one or more plot statements, each of which shares the same plot area, axes, and legends. The layout in this example specifies only a single element: a HISTOGRAM with bars showing the distribution of observations of the data column named WEIGHT.
Template Compilation
A GTL template describes
the structure and appearance of a graph to be produced, similar to
the way a TABLE template describes the organization and content of
a table.
All templates are stored,
compiled programs. The following source program produces a simple
GTL template named SCATTER:
proc template;
  define statgraph scatter;
    begingraph;
      layout overlay;
        scatterplot x=height y=weight;
      endlayout;
    endgraph;
 end;
run;
When this code is submitted,
the statement keywords and options are parsed, just as with any other
procedure. If no syntax error is detected, an output template named
SCATTER is created and stored in the default template folder SASUSER.TEMPLAT.
No graph is produced. Note the following:
-
Any required arguments in the template must be specified. In this example, X= and Y= in the SCATTERPLOT statement must specify variables for the analysis, but no checking for the existence of these variables is done at compile time. (Unlike other SAS procedures, PROC TEMPLATE does not perform a compile and then run sequence, which includes variable validation.)
Run-Time Actions
To produce a graph,
a GTL template must be bound to a data source using the SGRENDER procedure.
The following example uses SGRENDER to bind the SCATTER template to
the SAS data set SASHELP.CLASS, which is delivered with the SAS system:
ods listing;
proc sgrender data=sashelp.class
              template=scatter;
run;
Generally, an ODS data
object is constructed by comparing the template references to column
names with variables that exist in the current data set. In the current
example, SASHELP.CLASS contains variables named HEIGHT and WEIGHT.
Because these variable names match the variables that are named on
template SCATTER, variables HEIGHT and WEIGHT are added to the data
object, while other variables in SASHELP.CLASS are ignored. (It is
possible for a template to define new computed columns based on existing
columns.)
After all the observations
have been read, the data object and template definition are passed
to a graph renderer, which produces an image file for the graph. The
image file is then automatically integrated into the ODS destination.
In this example, a PNG image is created in the LISTING destination.
The visual properties of the graph are determined by the ODS style
that is in effect.
Note: Template SCATTER is a restrictive
definition: it can create a plot only with variables named HEIGHT
and WEIGHT. A GTL template can be made more flexible by introducing
dynamics or macro variables that supply variables and other information
at run time. For more information, see Flexible Templates.