Basic Anatomy of an ODS Graph
The GTL is flexible
and able to produce many different types of graphs with varying layout
features. The following figure shows the basic anatomy of an ODS graph:
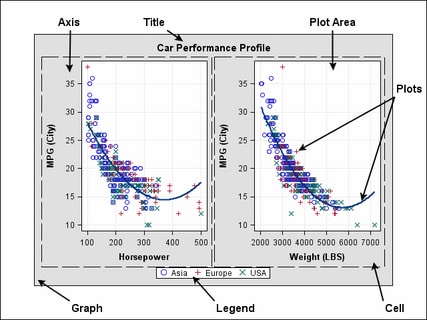
the output produced
from all of the statements that are nested in a BEGINGRAPH statement
block. The graph comprises all of the graphics elements in the template
definition.
refers collectively
to the area containing the plot areas. In this diagram, there are
two cells, each of which contains two axes for the plot area. A cell
can also contain descriptive text and legends. Graphs are often described
as single-cell or multi-cell.
the display area for
plot-statement results. This area is bounded by the axes (when present)
and can also contain data labels and other text that annotates the
graph.
refers collectively
to the axis line, the major and minor tick marks, the major tick values,
and the axis label.