Example Program and Statement Details
Example Graph
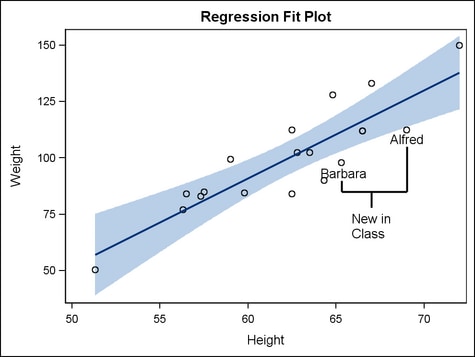
The following graph
was generated by the Example Program. The example
uses two BEGINPOLYLINE blocks to highlight two student data points.
The DRAWSPACE= option in the BEGINGRAPH statements specifies that
the polyline be drawn in the data space. The BEGINPOLYLINE statements
specify the starting X,Y points for two polyline, and the DRAW statements
complete the lines. The example also uses two DRAWTEXT statements
to label the data points of interest.
Example Program
proc template;
  define statgraph drawoval;
    begingraph / drawspace=datavalue;
      entrytitle "Regression Fit Plot";
      layout overlay;
        modelband "myclm";
        scatterplot x=height y=weight;
        regressionplot x=height y=weight / alpha=.01 clm="myclm";
          drawtext "Alfred" / x=69 y=112 anchor=top;
          drawtext "Barbara" / x=65.4 y=97 anchor=top width=15;
          beginpolyline x=69 y=105 ;
            draw x=69 y=85 ;
            draw x=65.3 y=85 ;
            draw x=65.3 y=90 ;
          endpolyline ;
          beginpolyline x=67 y=85 ;
            draw x=67 y=78 ;
          endpolyline ;
          drawtext "New in Class" / x=67 y=77 anchor=top width=15;
      endlayout;
    endgraph;
  end;

proc sgrender data=sashelp.class template=drawoval;
run;
Statement Summary
A polyline is built
by using the BEGINPOLYLINE statement to specify the polyline’s
starting X,Y coordinate, and then specifying the remaining points
by nesting a series of DRAW statements (see DRAW Statement) within the BEGINPOLYLINE block. The block is closed with
an ENDPOLYLINE statement. To manage the location and drawing units
for the polyline, you can use the XAXIS=, YAXIS=, XSPACE=, and YSPACE=
options.
For general
information about the types of elements that can be drawn with the
draw statements, the drawing space and drawing units that they use,
and how the drawn elements are anchored, see Key Concepts for Using Draw Statements. For detailed usage information, consult the SAS Graph Template Language: User's Guide.
Options
specifies an amount
to offset the polyline from discrete X values, or discrete Y values,
or both.
Default: 0 (no offset, the polyline is centered on discrete X values, or
discrete Y values, or both)
DRAWSPACE= GRAPHPERCENT | GRAPHPIXEL | LAYOUTPERCENT | LAYOUTPIXEL
| WALLPERCENT | WALLPIXEL | DATAPERCENT | DATAPIXEL | DATAVALUE
specifies a default
drawing space and drawing units for this BEGINPOLYLINE block.
Interaction: This statement and all of the draw statements inherit the global
DRAWPSACE= setting from the DRAWSPACE= option in the BEGINGRAPH statement.
Setting this option changes the setting for only this BEGINPOLYLINE
statement.
specifies whether the
polyline appears on top of (FRONT) or behind (BACK) the graph.
Interaction: If this option is set to BACK, the polyline is drawn behind background
areas, such as a layout or legend background.For elements that are obstructed because they are in the
back layer, you can suppress the display of filled areas in the graph.
Or, you can use transparency to manage the element visibility. For
more information, see About Drawing Layers.
specifies the properties
of the line segments for the polyline. See General Syntax for Attribute Options for the syntax
on using a style-element and Line Options for available line-options.
XSPACE= GRAPHPERCENT | GRAPHPIXEL | LAYOUTPERCENT | LAYOUTPIXEL
| WALLPERCENT | WALLPIXEL | DATAPERCENT | DATAPIXEL | DATAVALUE
specifies the drawing
space and drawing units for interpreting the X value.