Example Program and Statement Details
Statement Summary
The PIECHART statement
is used in a LAYOUT REGION, LAYOUT GRIDDED, or LAYOUT LATTICE block.
It cannot be used in LAYOUT OVERLAY block because a pie chart does
not have axes. The input data for the PIECHART statement is raw, unsummarized
input data. The PIECHART performs discrete binning for the CATEGORY
column and calculates appropriate summarization statistics (sum, mean,
and so on) based on the setting for the STAT= option.
By default, the fill
color of each pie slice is derived from the Color attribute of the
GraphData1–GraphDataN style elements. When the number of categories
exceeds the number of GraphDataN elements, the GraphData1–GraphDataN
colors are repeated, but the shade of each color is varied on each
cycle. The shade variations alternate between one shade lighter and
one shade darker on each cycle. The fill color of the “other”
slice (if shown) is derived from the Color attribute of the GraphOther
style element.
You can use the START= and CATEGORYDIRECTION= options to control the pie slice
positions and display order.
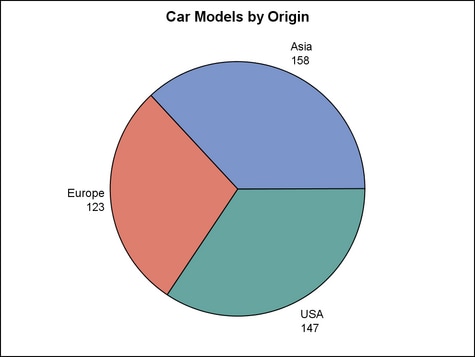
By default, the pie
slices are labeled with the CATEGORY and RESPONSE values, which are
displayed inside the slices. You can use the DATALABELLOCATION= and DATALABELCONTENT= options to control where the pie
slices are labeled and the label content.
By default if two or
more slices take up less than 4% of a pie, an “other”
slice is created by consolidating those small slices. To change the
default criteria, use the OTHERSLICE= and OTHERSLICEOPTS= options. The calculated “other”
slice is displayed as the last slice in the pie, and as the last legend
entry for the pie. If a category value is the same as the “other”
slice label, two slices might be displayed with the same label ("Other"
by default) and different fill attributes. In that case, both slices
are represented in the pie legend.
To create a pie slice
for missing CATEGORY values, specify INCLUDEMISSINGDISCRETE=TRUE in
the BEGINGRAPH statement. The fill color of the missing category slice
is assigned the fill color from the GraphMissing style element except
when a user-defined format is applied to the category value. In that
case, the missing category slice is assigned the fill color from a
GraphData1–GraphDataN style element in data order instead.
Arguments
(required argument)
specifies the column for the category values. Duplicated values of
CATEGORY are summarized into a unique value. All values are treated
as discrete.
specifies
a discrete attribute variable that is defined in a DISCRETEATTRVAR statement.
Options
specifies the color
and font attributes of the slice labels. See General Syntax for Attribute Options for the syntax
on using a style-element and Text Options for available text-options.
specifies the information
to display in the slice labels.
-
When STAT=PCT, the default is (CATEGORY PERCENT).
specifies whether to
display the slice labels within the pie slices or outside of the pie
circumference.
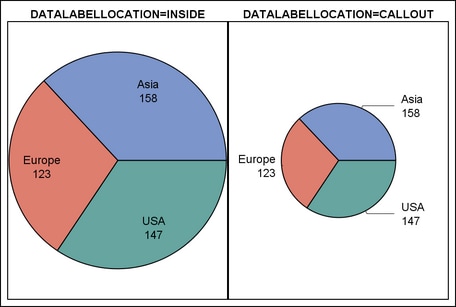
locates the slice labels
inside the pie slices.
Note: If a particular label does
not fit within the pie slice, the fit policy takes effect (set by
the LABELFITPOLICY= option).
enhances the visual
appearance of the filled pie slices.
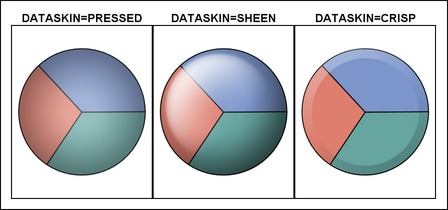
Requirement:
For this option to have any effect, DISPLAY=FILL must be in effect. Otherwise, this option is ignored.
Interaction: When
a data skin is applied, all slice outlines are set by the skin, and
the OUTLINEATTRS= option is ignored.
specifies the degree
of the transparency of all pie slices, outlines, and text.
Tip: The FILLATTRS= option can be used to set transparency
for just the pie slices. The OTHERSLICEOPTS= option can be used to specify transparency
for the “other” slice. You can combine this option with
FILLATTRS= and with OTHERSLICEOPTS= to set one transparency for the
outlines and text but a different transparency for the pie slices.
Example:
datatransparency=0.2 fillattrs=(transparency=0.6)
specifies whether to
display outlined pie slices, filled pie slices, or outlined and filled
pie slices.
a list of options,
enclosed in parentheses, that must include at least one of the following:
| OUTLINE | displays outlined pie slices. The default outline properties are set by the GraphOutline style element. |
| FILL | displays filled pie slices with each slice a different color. The default colors are set by the Color attribute of the GraphData1-GraphDataN style elements. The fill color of the “other” slice (if shown) is from the color attribute of the GraphOther style element. If FILL is not specified, an opaque pie is drawn using the background color of the containing layout. |
specifies the appearance
of the filled pie slices, excluding the “other” slice.
See General Syntax for Attribute Options for the syntax
on using a style-element and Fill Options for available fill-options.
Interaction: For
this option to have any effect, the fill must be enabled by the ODS
style or the DISPLAY= option.
Tip: The
FILLATTRS= suboption of the OTHERSLICEOPTS= option controls the visual properties
of the “other” slice.
Tip: The DATATRANSPARENCY= option sets the transparency for
all pie slices, outlines, and text. You can combine this option with
DATATRANSPARENCY= to set one transparency for the outlines and text
but a different transparency for the pie slices. Example:
datatransparency=0.2 fillattrs=(transparency=0.6)
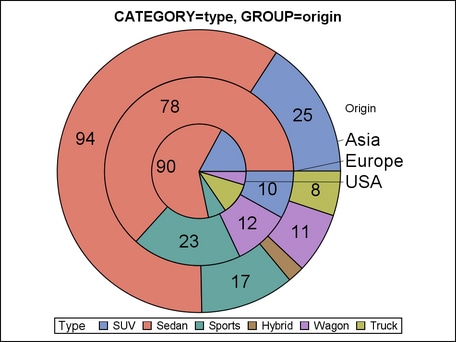
creates a separate
concentric annulus (or stacked cylinders) for each unique group value
of the specified column. The grouped rings are displayed in data order.
Interaction: When
this option is used, the unique column values are found and then the
slice colors are taken from the GraphData1 - GraphDataN style elements.
Interaction: Missing
values in the data can affect the group order. You can use the INCLUDEMISSINGGROUP= option to manage missing group values.
In addition, you can use INCLUDEMISSINGDISCRETE=TRUE in the BEGINGRAPH
statement to create pie slices for missing CATEGORY values.
specifies text attributes,
location, and other options for displaying group labels.
Default: The
group label and values are shown as a block of text to the right or
left of the pie. Slice labels are moved to the inside of the pie slices.
A callout is drawn from each group value to its annulus (or cylinder).
The following grouplabel-options are
available. One or more options can be specified as name
= value pairs, separated by blanks.
specifies the text
properties of the group label. See General Syntax for Attribute Options for the syntax
on using a style-element and Text Options for available text-options.
specifies the text
properties of the group values. See General Syntax for Attribute Options for the syntax
on using a style-element and Text Options for available text-options.
specifies
whether missing values of the GROUP column are included in the pie.
When INCLUDEMISSINGGROUP=TRUE and missing group values exist in the
data, a solid ring or inner pie is added to the pie chart to represent
the missing group. The missing group ring or inner pie is assigned
a fill color from the GraphData1-GraphDataN style elements in data
order.
specifies the label
fitting policy to be used if a particular label does not fit within
the pie slice.
Tip: This
option determines how labels are managed when DATALABELLOCATION=INSIDE and a particular label does
not fit within the pie slice.
specifies whether to
consolidate smaller pie slices into a single slice that represents
“other” values that are in the data, or whether to
display those smaller slices as separate pie slices.
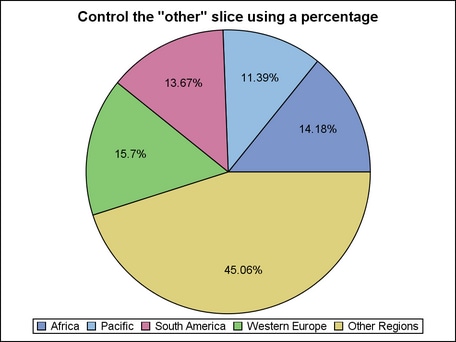
specifies the properties
of the “other” slice. Example:
piechart category=region / name="p"
  datalabelcontent=(percent) datalabellocation=inside
  otherslice=true
  othersliceopts=(type=percent percent=11 label="Other Regions") ;
The following other-slice-options are
available. One or more options can be specified as name
= value pairs, separated by blanks.
specifies the maximum
number of category values to represent with pie slices. Any remaining
values are consolidated into the “other” slice.
Interaction: For
this option to have any effect, TYPE=MAXSLICES must also be specified
among the suboptions for OTHERSLICEOPTS=.
Interaction: The
slices are counted in the order in which they are displayed. This
order is affected by the CATEGORYDIRECTION= option.
specifies the appearance
of the “other” slice's area fill. See General Syntax for Attribute Options for the syntax
on using a style-element and Fill Options for available fill-options.
specifies the properties
of the pie and slice outlines. See General Syntax for Attribute Options for the syntax
on using a style-element and Line Options for available line-options.
Interaction: For
this option to have any effect, outlines must be enabled by the ODS
style or the DISPLAY= option.
specifies which degree
between 0 and 360 serves as the starting position for the first pie
slice.
Details: A
value of 0 degrees corresponds to the three o'clock position. Degrees
can be either positive or negative. Positive values move the starting
position counterclockwise, and negative values move the starting position
clockwise. By default, successive slices are drawn counterclockwise
from the starting slice. You can change the default direction with
the CATEGORYDIRECTION= option.
Specifies the statistic
to be computed.
Interaction: When STAT=PCT, the default
label content is (CATEGORY PERCENT) instead of STANDARD. See DATALABELCONTENT= ALL | STANDARD | NONE | (content-options).
specifies the information
to display when the cursor is positioned over a pie slice. If this
option is used, it replaces all the information displayed by default.
Default: The
columns assigned to these roles are automatically included in the
tooltip information: CATEGORY and RESPONSE.
an ordered, blank-separated
list of unique PIECHART roles. PIECHART roles include CATEGORY, RESPONSE,
and GROUP. The RESPONSE role represents the computed statistic for
the CATEGORY value, based on the statistic that is set by the STAT= option.
Requirement: To
generate tooltips, you must include an ODS GRAPHICS ON statement that
has the IMAGEMAP option specified, and write the graphs to the ODS
HTML destination.
Tip: The
labels and formats for the TIP variables can be controlled with theTIPLABEL= and TIPFORMAT= options.
specifies display formats
for information defined by the tooltip roles.
Default: The
column format of the variable assigned to the role or BEST6. if no
format is assigned to a numeric column.
Requirement: This
option provides a way to control the formats of columns that appear
in tooltips. Only the roles that appear in the TIP= option are used. Columns must be assigned to the roles
for this option to have any effect.
specifies display labels
for information defined by the tooltip roles. Only the roles that
appear in the TIP= option are used.
Requirement: This
option provides a way to control the labels of columns that appear
in tooltips. Only the roles that appear in the TIP= option are used. Columns must be assigned to the roles
for this option to have any effect.