Example Program and Statement Details

Example Graph

The following graph was generated by the Example Program:
Example Three-Dimensional Bivariate Histogram

Example Program

proc template; 
  define statgraph bihistogram; 
    begingraph; 
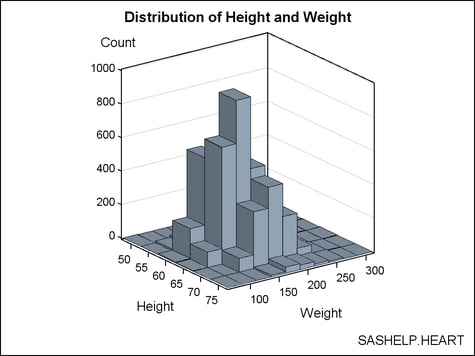
      entrytitle "Distribution of Height and Weight";
      entryfootnote halign=right "SASHELP.HEART"; 
      layout overlay3d / cube=false zaxisopts=(griddisplay=on);
        bihistogram3dparm x=height y=weight z=count / display=all; 
      endlayout; 
    endgraph; 
  end; 
run;  

data heart;
  set sashelp.heart(keep=height weight);
    if height ne . and weight ne .; 
  height=round(height,5);
  weight=round(weight,25);
run;

proc summary data=heart nway completetypes; 
  class height weight;
  var height;
  output out=stats(keep=height weight count) N=Count;
run;

proc sgrender data=stats template=bihistogram;
run;

Statement Summary

Because the BIHISTOGRAM3DPARM statement does not perform a binning computation on the input columns, you must pre-bin the data. In addition, input data for the statement must be binned by both X and Y. That is, the values for the X column and the Y column must form a complete, rectangular grid of bins. Input data with non-binned columns should be preprocessed with the KDE procedure (SAS/STAT), which enables you to set the number of bins for X and Y. Alternatively, the data can be preprocessed with a technique similar to the example, where a pre-defined bin width is used.
The input data for Z= column must be nonnegative. In the graph display, the direction of the Z axis is upwards rather than outwards.
The BIHISTOGRAM3DPARM statement must be specified within a LAYOUT OVERLAY3D statement and cannot be nested under an OVERLAY, OVERLAYEQUATED, or PROTOTYPE layout.
BIHISTOGRAM3DPARM does not support the tooltips that are enabled by the IMAGEMAP= option in the ODS GRAPHICS statement.

Required Arguments

X=numeric-column | expression
specifies the bin location of the numeric X values.
Y=numeric-column | expression
specifies the bin location of the numeric Y values.
Z=nonnegative-numeric-column | expression
specifies the response values, such as the frequency counts, percentages, or densities.

Options

Statement Option
Description
Specifies whether to use bins as the basis for axis tick marks for the X and Y axes.
Specifies the degree of the transparency of the bins.
Specifies whether to display outlined bins, filled bins, or outlined and filled bins.
Specifies whether labels are drawn at the endpoints of the X bins and Y bins.
Specifies the appearance of the filled bins.
Specifies a label for the legend.
Assigns a name to a plot statement for reference in other template statements.
Specifies the appearance of the bin outlines.
Specifies that the data columns for this plot and the plot type be used for determining default axis features.
Specifies whether the X values represent midpoints, lower endpoints, or upper endpoints of the bins.
Specifies whether the Y values represent midpoints, lower endpoints, or upper endpoints of the bins.
BINAXIS=boolean
specifies whether to use bins as the basis for the X and Y axis tick marks.
Default: TRUE
FALSE
Standard axes are used, ignoring bin boundaries and midpoints set by the ENDLABELS= option.
TRUE
The ENDLABELS= option determines how the axis ticks and value labels are displayed. Some axis options for the X- and Y-axes might not apply.
Interaction: For this option to take effect, this plot must be the primary plot in the parent OVERLAY3D layout. For more information, see the PRIMARY= option.
DATATRANSPARENCY=number
specifies the degree of the transparency of the bins.
Default: 0
Range: 0 (opaque) to 1 (entirely transparent)
DISPLAY=STANDARD | ALL | (display-options)
specifies whether to display outlined bins, filled bins, or outlined and filled bins.
Default: STANDARD
STANDARD
displays filled bins with no outlines.
ALL
displays outlined, filled bins.
(display-options)
a list of options, enclosed in parentheses, that must include at least one of the following:
OUTLINE displays outlined bins
FILL displays filled bins
Use the OUTLINEATTRS= and FILLATTRS= options to control the appearance of the bins.
ENDLABELS=boolean
specifies whether labels are drawn at the endpoints of the X bins and Y bins.
Default: FALSE. Labels are drawn at the X bin and Y bin midpoints.
Interaction: For this option to take effect, this plot must be the primary plot in the parent OVERLAY3D layout. For more information, see the PRIMARY= option.
Interaction: This option is ignored if BINAXIS=FALSE. By default, BINAXIS=TRUE.
FILLATTRS=style-element | style-element (fill-options) | (fill-options)
specifies the appearance of the filled bins. See General Syntax for Attribute Options for the syntax on using a style-element and Fill Options for available fill-options.
Default: The GraphDataDefault style element.
LEGENDLABEL= "string"
specifies a label for the legend item that is associated with this plot.
Default: The string specified on the NAME= option.
Restriction: This option applies only to an associated DISCRETELEGEND statement.
NAME="string"
assigns a name to a plot statement for reference in other template statements.
Default: no default
Restriction: The string is case sensitive, cannot contain spaces, and must define a unique name within the template.
Interaction: The string is used as the default legend label if the LEGENDLABEL= option is not used.
The specified name is used primarily in legend statements to coordinate the use of colors and line patterns between the graph and the legend.
OUTLINEATTRS=style-element | style-element (line-options) | (line-options)
specifies the appearance of the bin outlines. See General Syntax for Attribute Options for the syntax on using a style-element and Line Options for available line-options.
Default: The GraphOutlines style element.
PRIMARY=boolean
specifies that the data columns for this plot and the plot type be used for determining default axis features.
Default: FALSE
Restriction: This option is ignored if the plot is placed under a GRIDDED or LATTICE layout block.
Details: This option is needed only when two or more plots within an overlay-type layout contribute to a common axis. For more information, see When Plots Share Data and a Common Axis.
XVALUES= MIDPOINTS | LEFTPOINTS | RIGHTPOINTS
specifies whether the input X values represent midpoints, lower endpoints, or upper endpoints of the bins.
Default: MIDPOINTS
YVALUES= MIDPOINTS | LEFTPOINTS | RIGHTPOINTS
specifies whether the input Y values represent midpoints, lower endpoints, or upper endpoints of the bins.
Default: MIDPOINTS