Generalized Macro for BOXPLOTPARM Data
%macro boxcompute(indsn=,x=,y=,outdsn=boxdata,datalabel=,
                  qntldef=5,table=no);
/* NOTE: INDSN, X and Y are required parameters, where
   INDSN = input SAS data set
   X = categorical variable (num or char)
   Y = response variable (num)
   OUTDSN = output dataset. It contains these variables:
      STAT: Statistic names for BOXPLOTPARM
      VALUE: values for STAT type
      X: X variable values
      DATALABEL: outlier labels from the DATALABEL= variable
      N, Mean, Median, Std if TABLE=YES
   DATALABEL= variable used to label outliers (num or char)
   QNTLDEF = 1|2|3|4|5
     (how to compute quantiles - see PROC SUMMARY)
   TABLE = YES | NO
     (add additional data to build table of statistics)
 */
  %macro varinfo(dsid,varname,role,rc);
   /* utility macro for obtaining variable info */
    %local varnum;
    %if %length(&varname)=0 %then %do;
      %let &rc=0;  %return;
    %end;
    %let varnum=%sysfunc(varnum(&dsid,&varname));
    %if &varnum > 0 %then %do;
      %let &role.label=%sysfunc(varlabel(&dsid,&varnum));
      %if  %length(&&&role.label)=0 %then
         %let &role.label=%sysfunc(varname(&dsid,&varnum));
      %let &role.fmt=%sysfunc(varfmt(&dsid,&varnum));
      %let &rc=0;
    %end;
    %else %do;
      %put ERROR: %upcase(&role) variable &varname not found.;
      %let &rc=1;
    %end;
  %mend varinfo;

/* validate dataset and variables */
%local dsid ylabel xlabel datalabellabel
       yfmt xfmt datalabelfmt rc_y rc_x rc_d;
%let dsid=%sysfunc(open(&indsn));
%if &dsid %then %do;
   %varinfo(&dsid,&y,Y,rc_y)
   %varinfo(&dsid,&x,X,rc_x)
   %if %length(&datalabel) %then
      %varinfo(&dsid,&datalabel,DATALABEL,rc_d);
   %else %let rc_d=0;
   %let dsid=%sysfunc(close(&dsid));
   %if &rc_y or &rc_x or &rc_d %then %return;
%end;
%else %do;
   %put ERROR: Input dataset &indsn not found.;
   %return;
%end;

/* compute basic summary statistics */
proc summary data=&indsn(rename=(&y=VALUE &x=X))
             nway qntldef=&qntldef;
  class x;
  var value;
  output out=summary(drop=_type_ _freq_) n=N mean=Mean
             median=Median q1=Q1 q3=Q3 std=STD / noinherit;
run;
proc sort data=&indsn(keep=&x &y &datalabel)
  %if %length(&datalabel) %then
    out=sorted(rename=(&x=X &y=VALUE &datalabel=DATALABEL));
  %else out=sorted(rename=(&x=X &y=VALUE));
;  by &x;
run;
/* compute fences, MIN, MAX and any outliers for X values */
data outliers;
  length STAT $10;
  %if %length(&datalabel) %then
   %do;
    keep STAT X VALUE DATALABEL;
    label VALUE="&ylabel" X="&xlabel"
          DATALABEL="&datalabellabel";
    format VALUE &yfmt X &xfmt DATALABEL &datalabelfmt;
   %end;
  %else
   %do;
    keep STAT X VALUE;
    label VALUE="&ylabel" X="&xlabel";
    format VALUE &yfmt X &xfmt;
   %end;
  retain lowerFence upperFence farLowerFence farUpperFence
         tempmin tempmax;
  merge sorted summary; by x;

  /* perform computations for each X value */
  if first.X then do;
     lowerFence=q1-((q3-q1)*1.5);
     upperFence=q3+((q3-q1)*1.5);
     farLowerFence=q1-((q3-q1)*3);
     farUpperFence=q3+((q3-q1)*3);
	 /* these computations for MIN and MAX result
	    in the same values produced by the BOXPLOT
	    statement, however they can be modified to
	    satify other statistical definitions */
     if value <= upperFence then tempmax=value;
     else tempmax=.;
     if value => lowerFence then tempmin=value;
     else tempmin=.;
  end;
  /* recompute MAX and MIN for each obs */
  if 0 <= sum(upperFence,-value) then
     tempmax=max(tempmax,value);
  if 0 <= sum(value,-lowerFence) then
     tempmin=min(tempmin,value);
  /* write out both types of outliers */
  if value < farLowerFence or value > farUpperFence then do;
     stat="FAROUTLIER"; output;
  end;
  else if value < LowerFence or value > UpperFence then do;
     stat="OUTLIER"; output;
  end;
  /* write out MIN and MAX for each X value */
  if last.X then do;
    value=tempmin; stat="MIN"; output;
    value=tempmax; stat="MAX"; output;
  end;
run;
/* transpose the stats into the columns
   required by BOXPLOTPARM */
data transpose(keep=x stat value);
  length STAT $10;
  set summary;
  array stats{*} n--std;
  do i=1 to dim(stats);
    stat=upcase(vname(stats{i}));
    VALUE=stats{i};
    output;
  end;
run;
/* interleave the obs by the X variable */
data &outdsn;
  set transpose outliers; by X;
run;
/* merge the output stats for building a stat table */
%if %upcase(&table)=YES %then %do;
  data &outdsn;
    merge &outdsn summary; by X;
  run;
%end;
%mend boxcompute;
Here is
the macro invocation to produce the data for the graph shown in the
section Example Program and Statement Details of BOXPLOTPARM Statement .
%boxcompute(indsn=sashelp.cars,x=type,y=mpg_city,
            datalabel=make);

proc template;
  define statgraph boxplotparm1;
    begingraph;
      entrytitle "City Mileage for Vehicle Types";
      layout overlay;
        boxplotparm y=value x=x stat=stat /
         datalabel=datalabel spread=true ;
      endlayout;
    endgraph;
  end;
run;

proc sgrender data=boxdata template=boxplotparm1;
run;
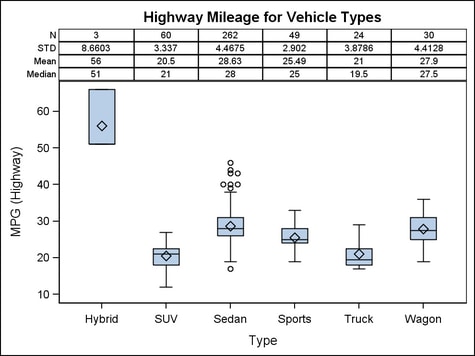
%boxcompute(indsn=sashelp.cars,x=type,y=mpg_highway,
            outdsn=boxdata2,table=yes);

proc template;
  define statgraph boxplotparm2;
    begingraph;
      entrytitle "Highway Mileage for Vehicle Types";
      layout lattice / rowweights=(.04 .04 .04 .04 .84);
        blockplot x=x block=n /
          display=(values label outline) valuehalign=center
          labelattrs=graphdatatext valueattrs=graphdatatext;
        blockplot x=x block=std /
          display=(values label outline) valuehalign=center
          labelattrs=graphdatatext valueattrs=graphdatatext;
        blockplot x=x block=mean /
          display=(values label outline) valuehalign=center
          labelattrs=graphdatatext valueattrs=graphdatatext;
        blockplot x=x block=median /
          display=(values label outline) valuehalign=center
          labelattrs=graphdatatext valueattrs=graphdatatext;
        boxplotparm y=value x=x stat=stat /
          datalabel=datalabel spread=true;
      endlayout;
    endgraph;
  end;
run;

proc sgrender data=boxdata2 template=boxplotparm2;
run;