Annotating the Graph

Add a Line Annotation to the Graph

You can annotate the graph that you edited in Editing the Graph.
In this step, you draw a red line to represent the approximate average height.
To draw a line:
  1. Click the line icon Line icon in the Graph toolbar.
  2. Position your cursor at a starting position along the Y axis and drag the line horizontally across the plot to the alternate Y axis.
  3. Right-click the line and select Annotation Properties. The Annotation Properties dialog box appears.
  4. On the Appearance tab, select the red color from the Color list box.
    Annotation Properties, Appearance tab
  5. Do the following.
    1. Select the Position tab.
    2. Make sure Start is selected in the Line Point list box, and enter 62 in the Vertical list box.
      Annotation Properties, Position tab
    3. Select End from the Line Point list box, and enter 62 in the Vertical list box.
  6. Click OK.

Add Text to the Graph

To add a text annotation:
  1. Click the text icon text icon in the Graph toolbar, or select Insertthen selectText from the main menu.
  2. Click the area of the graph where you want to position your text. A text box appears.
  3. Drag one of the circles on the border of the text box to the right or left to widen the text box.
    Text box border circles
  4. Enter the following text in the box: Approximate average height: 62 inches
    The width of the text box determines the maximum width of the text line. If a line exceeds the width of the text box, then the text wraps to the next line.
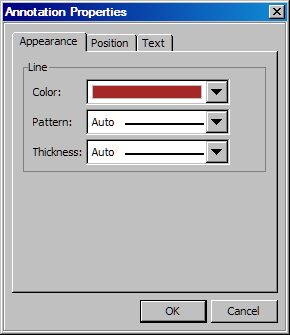
  5. Select the entire text string and use the Formatting toolbar to change the color of the font. Select a red color from the color list box font color list box. For details, see Using the Color List Box.

View Your Annotation Changes

Here are the results of the annotations that you have added to the graph.
Annotations Made to the Simple Graph