Modifying a Multi-Cell Graph That Uses a Single Data Set

About the Classification Panel Example

This example uses the Heart data set in the SAS Help library. The example provides the cholesterol distribution for a group of men and women. The code uses the SGPANEL procedure to create a classification panel with two cells. Both cells are driven by the same data set.
Classification Panel Example

Code for the Classification Panel Example

ods listing sge=on;
proc sgpanel data=sashelp.heart noautolegend;
  title "Cholesterol Distribution in Heart Study";
  panelby sex;
  histogram cholesterol;
  density cholesterol;
run;

title;
ods listing close;

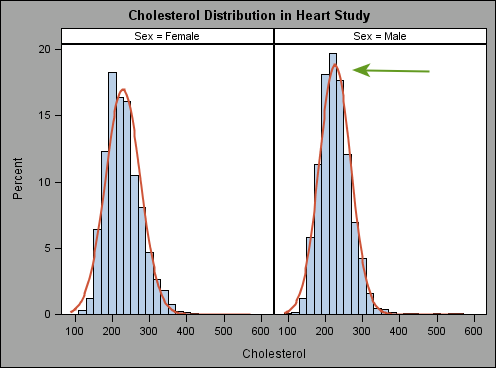
Modify the Classification Panel Example

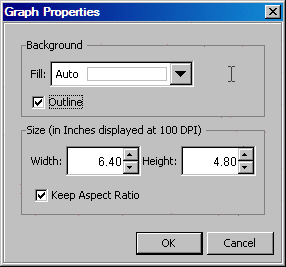
Change the Background Color

When you change the background fill color, you modify the graph’s properties.
  1. Right-click the graph and select Graph Properties. The Graph Properties dialog box appears.
    Graph Properties dialog box
  2. In the Background section, select a gray color from the Fill list box. For details about setting the color, see Using the Color List Box.
    The outside of the plot area changes to the color that you selected.
  3. Click OK.

Change the Color of the Density Curve

When you change the color of the density curve in the cells, you modify plot properties. For the type of multi-celled graph used in this example, any change that you make to plot properties in one cell affects all cells in the graph.
  1. Right-click inside either cell and select Plot Properties. The Plot Properties dialog box appears.
  2. In the Plots tab, select DENSITY from the Plot list box.
  3. Select an orange color from the Color list box.
  4. Click OK.

Add an Arrow Annotation to One of the Cells

You can annotate an individual cell in a multi-cell graph. In this step, you draw a green arrow in one of the cells.
To draw an arrow:
  1. Click the arrow icon Arrow icon in the Graph toolbar.
  2. Position your cursor at a starting position in the graph and drag the arrow toward a data point of interest.
  3. Right-click the arrow and select Annotation Properties. The Annotation Properties dialog box appears.
  4. In the Appearance tab, select the green color from the Color list box.
  5. Click OK.

Results of Your Changes

Your changes look similar to the following:
Modified Classification Panel