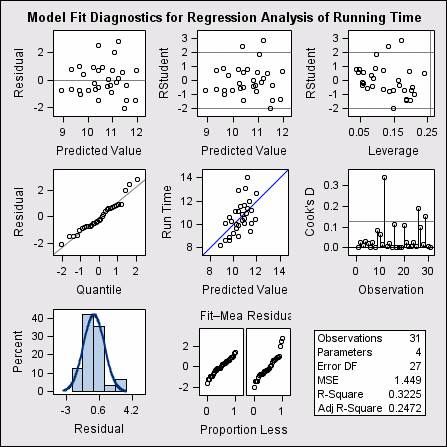
Modifying Individual Plots in a Diagnostic Panel
About the Fitness Example
This example analyzes
the resting and active pulse rates for participants in a physical
fitness study. As part of the study, individuals of various ages and
weights run for a variable amount of time, and their pulse rates are
measured before and after the run. The code uses the REG procedure
to create a graph with paneled diagnostic plots. The running time
(RUNTIME) is a response variable in the study.
Code for the Fitness Example
ods listing sge=on;
data fitness;
   input age weight oxy runtime rstpulse runpulse maxpulse;
   datalines;
44 89.47  44.609 11.37 62 178 182
40 75.07  45.313 10.07 62 185 185
44 85.84  54.297  8.65 45 156 168
42 68.15  59.571  8.17 40 166 172
38 89.02  49.874  9.22 55 178 180
47 77.45  44.811 11.63 58 176 176
40 75.98  45.681 11.95 70 176 180
43 81.19  49.091 10.85 64 162 170
44 81.42  39.442 13.08 63 174 176
38 81.87  60.055  8.63 48 170 186
44 73.03  50.541 10.13 45 168 168
45 87.66  37.388 14.03 56 186 192
45 66.45  44.754 11.12 51 176 176
47 79.15  47.273 10.60 47 162 164
54 83.12  51.855 10.33 50 166 170
49 81.42  49.156  8.95 44 180 185
51 69.63  40.836 10.95 57 168 172
51 77.91  46.672 10.00 48 162 168
48 91.63  46.774 10.25 48 162 164
49 73.37  50.388 10.08 67 168 168
57 73.37  39.407 12.63 58 174 176
54 79.38  46.080 11.17 62 156 165
52 76.32  45.441  9.63 48 164 166
50 70.87  54.625  8.92 48 146 155
51 67.25  45.118 11.08 48 172 172
54 91.63  39.203 12.88 44 168 172
51 73.71  45.790 10.47 59 186 188
57 59.08  50.545  9.93 49 148 155
49 76.32  48.673  9.40 56 186 188
48 61.24  47.920 11.50 52 170 176
52 82.78  47.467 10.50 53 170 172
;

***************************************
* PANEL PROC CALLS                    *
***************************************;

proc reg data=fitness plots=diagnosticspanel;
 model runtime = maxpulse age rstpulse;
 ods select diagnosticspanel;
title'*** Reg:  (1-packed) ***';
quit;

title;
ods listing close;