Editing the Graph

Change the Graph's Title

Change the graph's title to make it more meaningful to your target audience.
  1. Double-click the title (Leverage Diagnostics).
  2. Select all of the text and type the new title Analysis of Economy Growth.

Add a Footnote to the Graph

Add a footnote that shows the respective year for the data.
  1. Click the footnote icon Footnote icon in the Graph toolbar. A text box appears at the bottom of the graph and displays the highlighted text Insert Footnote.
  2. Type Data source: De Long and Summers (1991).

Move the Legend

Once the footnote has been added, the bottom of the graph looks crowded. Because there is ample space available inside the plot area, move the legend into the plot in the lower right corner.
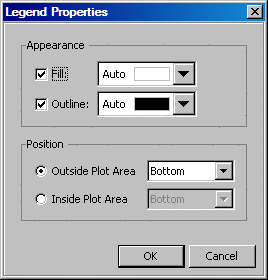
  1. Right-click the legend and select Legend Properties from the pop-up menu. The Legend Properties dialog box appears.
    Legend Properties dialog box
  2. Select the Inside Plot Area button.
  3. Select Bottom Right from the list box.
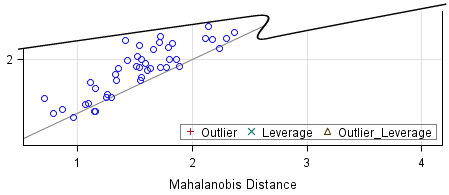
  4. Click OK. The legend appears within the plot area.
    Legend inside plot area

Change the Line Pattern

Change the horizontal reference line so that it is a dashed line.
  1. Right-click the line and select Plot Properties from the pop-up menu.
  2. Select the Plots tab if it is not already selected.
  3. Make sure that ReferenceLine1 is selected in the Plot list box.
  4. From the Pattern list box, select the third pattern (dashed line) in the list. The reference line changes to a dashed pattern.
  5. Click OK.