Adding Rows and Columns to a Graph

Overview of Adding Rows and Columns

In a heterogeneous panel, the cells in a graph are arranged in rows and columns. Each cell is defined independently and can contain different types of plots. For more information about cells, see Components of a Graph.
You can add multiple rows and columns to a graph. The limit to the number of rows and columns that you can add depends on the size of your graph. As you add more rows and columns, the individual cells shrink proportionally.
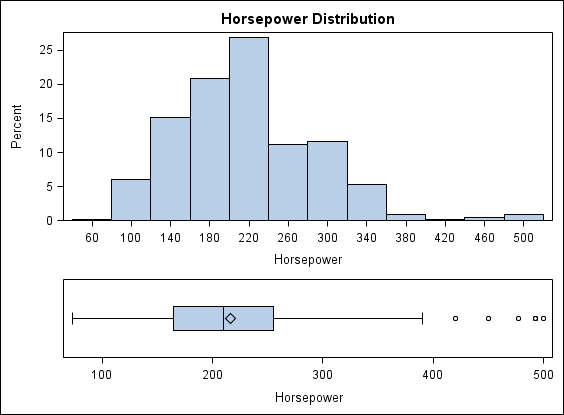
Here is an example of a heterogeneous panel that has one column and two rows, for a total of two cells:
Example heterogeneous panel
You can add only complete rows and columns to the graph. In addition, cells cannot span across multiple rows or columns. For example, suppose that you have a graph layout with two rows and two columns.
Example Layout
Cell grid
You cannot have two cells in the first row and a merged single cell in the second row.
Unsupported Layout
Invalid cell grid
However, you can leave a cell blank as shown here.
Modified Layout
Uneven cell grid

Add a Row or Column

To add a row or column to a graph:
  1. Create a new graph or open an existing graph.
    Note: The graph cannot be a classification panel or a scatter plot matrix. You cannot add rows and columns to those types of graphs.
  2. Right-click anywhere within the plot area of the graph and choose one of the following:
    • Add a Row
    • Add a Column
    Note: You can also access these commands from the Insert menu and from the toolbar.
    Depending on your choice, a row or column is added to the graph. The row or column contains one or more empty cells.
  3. (Optional) Repeat the previous step to add another row or column to the graph.
After you add cells to a graph, you must manually add plots to the new cells and assign data to those plots. For more information, see these topics: