To create a shared-variable
graph, you first define one or more shared variables. Then, you add
one or more plots and assign the shared variables to the plot roles.
To create a shared-variable
graph:
-
Select
File NewBlank
Shared Variable Graph
NewBlank
Shared Variable Graph. The following occur:
-
A blank shared-variable graph is
created. The graph is identified by a shared-variable icon

in the top left corner.
-
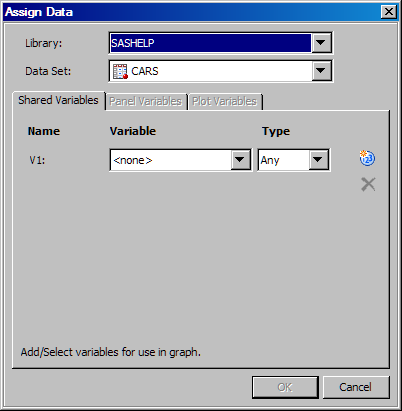
The
Assign Data dialog box appears and displays the
Shared Variables tab. The other tabs are present but are dimmed.
-
In the
Assign
Data dialog box, specify the SAS library and data set
that you want to use for the graph. Select the appropriate items from
the
Library and
Data Set list boxes.
-
Assign data variables
to one or more shared variables:
-
Select a data variable
from the
Variable list box.
-
Select a variable type
from the
Type list box.
Though you can leave
the default
Any type, it is good practice
to specify a variable type. Some plots, such as histograms, require
that the variable be a particular type.
Once you specify a variable
type, the
Variable list box contains only
the variables of that type.
-
To add another shared
variable, click the Add a Variable icon

and then repeat the previous two steps for the new
variable. Shared variables are identified as V1, V2, and so on.
-
When you are finished
assigning shared variables, click
OK.
-
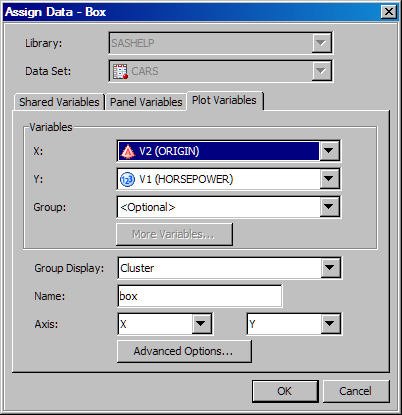
The
Assign
Data dialog box appears and displays the
Plot Variables tab.
-
In the
Variables section, assign a shared variable to each plot role that is listed.
(Some roles might be optional.)
For example, in the
following display, you would assign a variable to the X and Y roles.
For more information
about plot roles, see About Plot Roles. Note:
-
Only predefined shared variables
are available from the list boxes.
-
Some plots require a variable of
a specific type.
For example, the analysis
variable for a histogram must be a numeric type. If the shared variable
used has a type of
Any in the
Shared Variable tab, then the ODS Graphics Designer
displays a warning message and changes the type to numeric.
-
You cannot change the library or
data set at this time. Their respective list boxes are dimmed.
-
The
Fit an existing
plot check box is not available for plot overlays, such
as the normal plot. This check box is available only for non-shared-variable
graphs.
The procedure for assigning
shared variables is similar to the procedure for assigning data variables.
For more information,
see Assign Data to a New Plot.
-
Perform additional steps
as needed to customize your graph. For example, you might add another
plot or more cells to the graph, or specify panel variables. You can
also add titles, footnotes, and make other changes to the graph.
For more information
about the tasks that you can perform, see High-Level Steps for Designing Graphs.