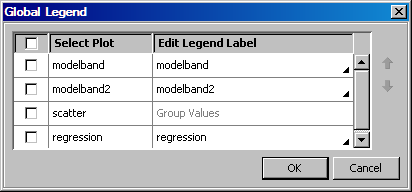
To add a legend to a
cell, click and drag the appropriate legend icon from the
Insets panel to the cell.
|
To add a discrete legend,
click and drag the Discrete Legend icon to the cell. The legend is
placed near the location where the icon was dropped. By default, all
plots in the cell are displayed in the legend.
|
|
If the plot is a contour
plot with a contour type of fill or gradient, then click and drag
a Gradient Legend icon to the cell. The gradient legend is displayed
on the right side of the cell.
|
You can also right-click
inside a graph cell and choose
Add an Element. Then click the legend icon from the
Elements pop-up window.