Creating a Classification Panel
Methods for Creating a Classification Panel
The ODS
Graphics Designer enables you to create classification panels in several
ways:
-
If the classification panel that you want to create exists in the Graph Gallery (in the Panels tab), then you can create the graph by opening the predefined graph from the gallery. For more information, see Create a Classification Panel by Using the Graph Gallery.
-
You can start from a blank graph window and then add one or more plots to create your graph. When you assign data to the plot, you specify both plot and panel variables. For more information, see Create a Classification Panel from a Blank Graph Window.
-
If you have an existing single-cell graph that you want to use as the basis for your classification panel, you can convert the single-cell graph to a panel. Most single-cell graphs can be converted to classification panels. For more information, see Change a Single-Cell Graph to a Classification Panel.
Create a Classification Panel by Using the Graph Gallery
The Panels tab of the Graph Gallery contains several predefined
classification panels. For graphs that are created from the Graph
Gallery, placeholder data is assigned to the graph. You typically
will change the data as appropriate for your graph.
-
Open the Graph Gallery if it is not already open. For instructions, see Open and Use the Graph Gallery.
-
Click the Plot Variables tab and assign variables for the plot. For more information, see Change the Data Assignment for a Plot in a Graph.
After
you have created a graph, you can perform additional steps to customize
your graph. For example, you might add another plot to the graph or
change plot properties. You can also add titles, footnotes, and make
other changes to the graph. For more information about the tasks you can perform, see High-Level Steps for Designing Graphs.
Create a Classification Panel from a Blank Graph Window
-
Add a plot to the blank graph. For more information, see Add a Plot to a Graph.
-
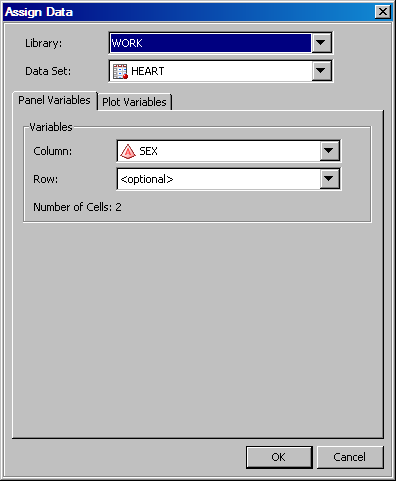
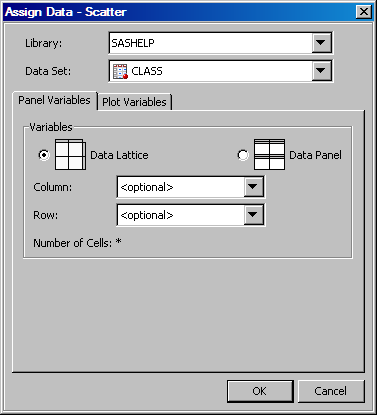
In the Assign Data dialog box, assign the data for the plot in the graph. For more information, see Assign Data to a New Plot.
-
Select the Data Lattice or the Data Panel check box. For more information, see About Data Lattices and Data Panels.

After
you have created a graph, you can perform additional steps to customize
your graph. For example, you might add another plot to the graph.
You can also add titles, footnotes, and make other changes to the
graph. For
more information about the tasks you can perform, see High-Level Steps for Designing Graphs.
Change a Single-Cell Graph to a Classification Panel
-
If necessary, assign variables to the plot roles. For more information, see Change the Data Assignment for a Plot in a Graph.
-
Select the Data Lattice or the Data Panel check box. For more information, see About Data Lattices and Data Panels.
After
you have modified the graph, you can perform additional steps to customize
your graph. For example, you might add another plot to the graph or
change plot properties. You can also add titles, footnotes, and make
other changes to the graph. For more information about the tasks you can perform, see High-Level Steps for Designing Graphs.
About Data Lattices and Data Panels
When you
change the data assignment for a classification panel, you can select
one of the following layout options:
Headers appear along
the top (for column classification variables) and the side (for row
classification variables).
If there are no observations
for a particular crossing of the classification variables, the designer
creates a blank cell for the crossing. For example, suppose that you
create a graph with two classification variables: gender and year.
Now suppose that there is no data for females in the year 2005. The
designer creates a cell for females in 2005, but leaves the cell blank.
Headers appear in each
cell.
If there are no observations
for a particular crossing of the classification variables, the designer
might not create the cell. The designer creates blank cells only to
complete the panel grid. For example, suppose that your graph contains
10 columns and 10 rows, and only 40% of the cells have data. Instead of having blank cells (as with the lattice) for 60 of
the 100 cells, the designer creates a smaller graph. In this example,
the graph contains eight rows and five columns.