Basic Structure of a Typical Graph Template

Graphs are constructed from two underlying components: a data object supplied by a procedure at run time and a compiled template that is designed to work with this data object. Together, the data object and the template form an output object that ODS displays in one or more output destinations.
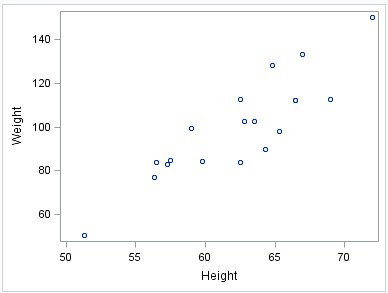
All graph GTL programs use the TEMPLATE procedure to define a STATGRAPH template. Here is a short GTL program.
proc template;                             /* procedure statement */
define statgraph customGraphs.scatter;     /* graph definition statement */
  begingraph;                              /* container statement */
    layout overlay;                        /* layout block statement */
      scatterplot X=height Y=weight;       /* plot statement */
    endlayout;                             /* close the layout block */
  endgraph;                                /* close the container block */
end;                                       /* close the graph definition */
run;
Here are the noteworthy features of this program:
  • The DEFINE STATGRAPH statement is required to open a definition block that defines and names the graph template. The END statement closes the template definition.
  • A BEGINGRAPH statement block is required to define the outermost container for the graph. It must contain at least one LAYOUT block. The ENDGRAPH statement closes the container block.
  • The LAYOUT statement block is required for specifying the layout structure of the graph. To generate a plot, the layout block must contain at least one plot statement. The ENDLAYOUT statement closes the layout block.
The TEMPLATE procedure must be run to compile the template and save it in the template store.
The template can be executed using the SGRENDER procedure. The procedure uses the DATA= option to specify the data source and the TEMPLATE= option to specify the template to use for rendering the graph.
Here is an example SGRENDER procedure:
proc sgrender data= sashelp.class template= customGraphs.scatter; 
run;
Note: In this example, the data set must contain the variables that are specified in the plot statement of the template.
Scatter Plot Output for the SGRENDER Procedure
Output for the SGRENDER Procedure