Example of Using the Editor

About This Example

This example shows how you might edit and annotate a graph that was created with the SGPLOT procedure. These tasks use some of the toolbar functions previously described. At the completion of the tasks in this example, the resulting graph is displayed:
Edited and Annotated Graph Example
Results of Editing the Scatter Plot

Step One: Create and Open an Editable Graph

  1. In SAS, execute the following code. The SGE = ON option in the ODS destination statement creates an editable graph.
    ods html sge = on;                 /* enable editable graph creation */
    proc sgplot data=sashelp.class;    /* procedure statement */
      scatter x=height y=weight        /* plot statement with a group option*/
              / group=sex;
    run;
    ods html sge = off;                /* disable editable graph creation */
    The SAS Results Viewer displays a scatter plot, shown here.
    Basic Scatter Plot
    Your program also created an ODS Graphics Editor (SGE) file that you can edit.
  2. Locate this SGE file by selecting Viewthen selectResults from the main menu.
  3. Click the expansion icon in the SAS Results window to show the SGE file just created with the SGPLOT procedure.
  4. Double-click the SGE file, which is identified by the ODS Graphics Editor icon icon.
    The ODS Graphics Editor opens and displays the graph for editing. You are now ready to edit the graph using the various interactive tools built into the editor.

See Also

For more information about the SGPLOT procedure, see Using the ODS Graphics Procedures .
For more information about creating editable graphs, see Creating Editable Graphics in SAS ODS Graphics Editor: User's Guide.

Step Two: Add and Format a Title

  1. To add a title, in the ODS Graphics Editor select Insertthen selectTitle. Alternatively, click the Title icon Title icon in the Graph toolbar.
    The Insert Title text box is displayed at the top of the graph.
  2. Enter the text Study of Weight and Height in the text box.
  3. Format the title that you just created.
    1. In the Formatting toolbar at the top of the window, select the Arial Rounded MT Bold font from the font drop-down list font family drop-down list
      Note: If the Formatting toolbar is dimmed, select the title to make the toolbar available.
    2. Click the Bold button Bold button to undo the text boldface, and the Italic button Italic button to italicize the text.
    3. Press ENTER to preserve your formatting selections.

Step Three: Modify the Axis Labels

  1. Double-click the Height X-axis label.
  2. Move your cursor to the end of the text and type (IN).
  3. Press ENTER to preserve the new text.
  4. Double-click the Weight Y-axis label.
  5. Move your cursor to the end of the text and type (LBS).
  6. Press ENTER to preserve the new text.

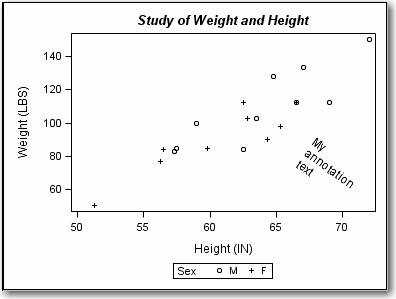
Step Four: Add and Rotate a Text Annotation

  1. Click the Text button text icon in the Graph toolbar.
  2. Click the area of the graph where you want to position your text—for example the lower right quadrant of the graph. A text box appears.
  3. Enter My annotation text in the box. The width of the text box determines the maximum width of the text line. If a line exceeds the width of the text box, then the text wraps to the next line. If needed, drag one of the circles on the border of the text box to the right or left to widen the text box.
    Text box border circles
  4. To rotate the text annotation, follow these steps:
    1. Position your cursor in the circle above the text box.
      The cursor changes to a rotated arrow. cursor rotated at top of handle
    2. Click and drag the rotated arrow to the left or right. You can rotate the entire box anywhere within a 360 degree radius.
  5. Click anywhere in the graph outside the text box to preserve the text.

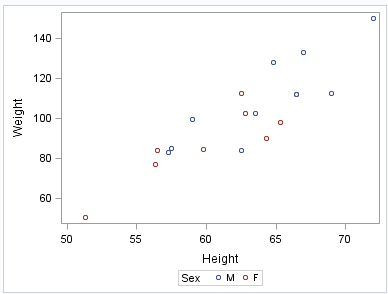
Step Five: Change the Style and Print the Graph

By default, graph SGE files use the active ODS destination style that is specified in the SAS program. If no style is specified, then the default style is used for the ODS destination.
  1. Change the graph’s style in order to make the graph more suitable for printing with a black-and-white printer.
    Select Formatthen selectStylethen selectJournal from the main menu.
    Note: When you apply the Journal style, all of the graphics elements change to shades of gray. However, if you had specified a different color for an element, the color would not change. When you explicitly set a color or other attribute, the specified attribute overrides the style setting.
  2. Print your edited and annotated SGE file.
    1. Select Filethen selectPrint from the main menu bar.
    2. Select print options from the Print window.
    3. Click OK.
    Note: You can also print PNG files from the ODS Graphics Editor. Or you can include a PNG file in a PDF document and then print the PDF document.

See Also

See Changing the Style That Is Applied to ODS Graphs for details about specifying a style for a graph either in the SAS program or in the editor.

Step Six: Save the Graph

Save the graph as an SGE file for further editing.
  1. Select Filethen selectSave As from the main menu.
  2. Select the directory where you want the graph to be saved. The default location is the current directory for the SAS program that generated the SGE file.
  3. Select SGE for the type of file to save. If you save the file in PNG format, then the graph is saved as a flat image. The graph in this format cannot be edited, though it can be annotated.