Working with Styles
Changing the Style That Is Applied to ODS Graphs
Changing the Style in Your Program
When you use the ODS
Graphics procedures or the Graph Template Language, you can easily
change a graph's appearance by changing the style for an ODS destination.
Changing the current style requires only the use of the STYLE= option
in an ODS destination statement. The ODS destination statement is
global and can be used anywhere in your SAS program. The statement
remains in effect until you explicitly change it or start a new SAS
session.
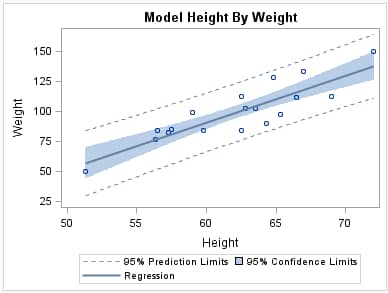
In the following example,
the ODS destination statement specifies HTML as the destination and
HTMLBlue as the style.
ods html style=htmlblue;
title "Model Height By Weight";
proc sgplot data=sashelp.class;
  reg x=height y=weight / clm cli;
run;
title;
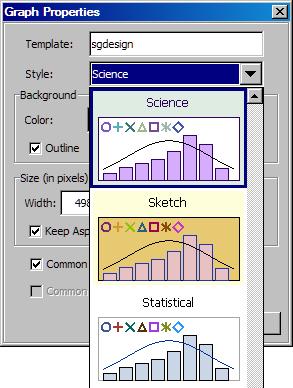
Changing the Style in the ODS Graphics Designer or the ODS Graphics Editor
In the ODS Graphics
Designer and the ODS Graphics Editor, you can use the menus to change
the style for a particular graph.
Editing a Style
ODS styles are based
on templates that define the specific visual attributes for your SAS
output. You can use the following software to edit style templates:
-
You can modify the ODS style template for a style to make persistent changes to that style. Using the TEMPLATE procedure, you can modify the default SAS style templates as well as custom styles that have been created at your site.For more information about the TEMPLATE procedure, see SAS Output Delivery System: User's Guide.
-
The ODS Graphics Designer has an interactive graphical interface for designing and modifying custom styles. This interface, called the Graph Style Editor, makes it easy to design styles that you can apply to your SGD graphs. You can also use these custom styles for graphs that are generated outside of the designer.
-
Create or modify a custom style. You cannot change the predefined SAS ODS styles. However, you can edit a SAS style, customize various style elements and attributes, and save your changes using a new style name.For complete instructions about creating custom styles, see Customizing Graph Styles in SAS ODS Graphics Designer: User's Guide.
Changing the Appearance of Individual Graphics Elements in a Plot
Overview of Changing Graphics Elements
ODS Graphics software
enables you to control the appearance of different parts of a graph
without changing the overall style. For example, you can change the
visual attributes of lines, bars, markers, text, and so on. These
changes are limited to the current graph.
Each graphics element
of a plot, such as a marker or a line, derives its visual attributes
from a specific style element from the active style. Within a given
style, the style elements give you more granular control of a graph's
visual elements.
It is recommended that
you specify style elements rather than explicit attributes whenever
possible. The attributes of a style element are chosen to provide
consistency and appropriate emphasis based on display principles for
statistical graphics. When you specify a particular attribute, you
override the style element. You might create a graph that is inconsistent
with the style. If you later change the style for the graph, your
override remains in effect and could clash with the new style.
Changing Graphics Elements in Your Program
The ODS Graphics software
gives you the following options for changing the appearance of graphics
elements in your program:
-
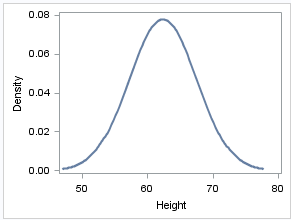
Many ODS Graphics procedure statements have options and suboptions that control the appearance of different parts of a graph. Typically, you can specify a style element, a hardcoded attribute value, or a combination of both. The following example specifies a style element for a density curve in a graph.
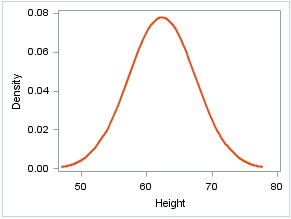
proc sgplot data=sashelp.class noautolegend;
density height / lineattrs=graphfit2;
run;
The following example specifies a style element and a hardcoded attribute value. This example changes the line to a dash-dash-dot pattern ( ).
).
density height / lineattrs=graphfit2 (pattern=dashdashdot);
-
The Graph Template Language uses similar syntax to specify a style element, a hardcoded attribute value, or a combination of both. The following example specifies the marker color for a scatter plot.
scatterplot x=XVAR y=YVAR / markerattrs=(color=red);
This example was taken from Example of Creating a Template.
Changing Graphics Elements in ODS Graphics Designer
The ODS Graphics Designer gives you numerous options
for changing the appearance of graphics elements in an SGD file. You
can use the designer’s graphical interface to specify the style
element or the element attributes (color, font size, and so on) of
a graphics element.
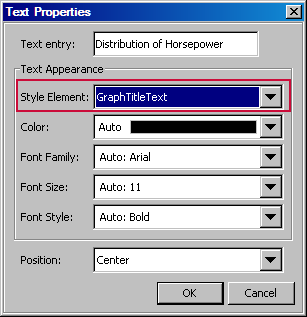
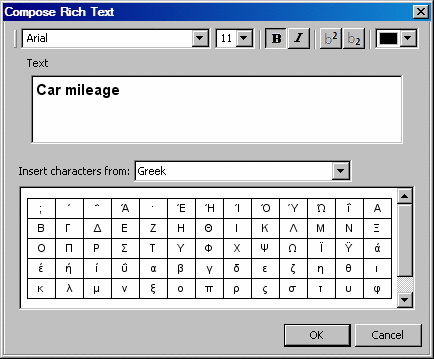
Changing Graphics Elements in ODS Graphics Editor
The editor enables you to change the visual attributes
of a graphics element, but not the style element. For example, to
change the properties of a graph title, right-click the title and
select Compose Rich Text from the pop-up menu.
From the Compose Rich Text dialog box, you can change the text and
the font properties. You can also use subscript or superscript values,
and you can enter Unicode characters.