Example 5: Filling the Area between Plot Lines
| Features: |
GOTIONS statement options: BORDER
|
| Sample library member: | GSYFAPL1 |
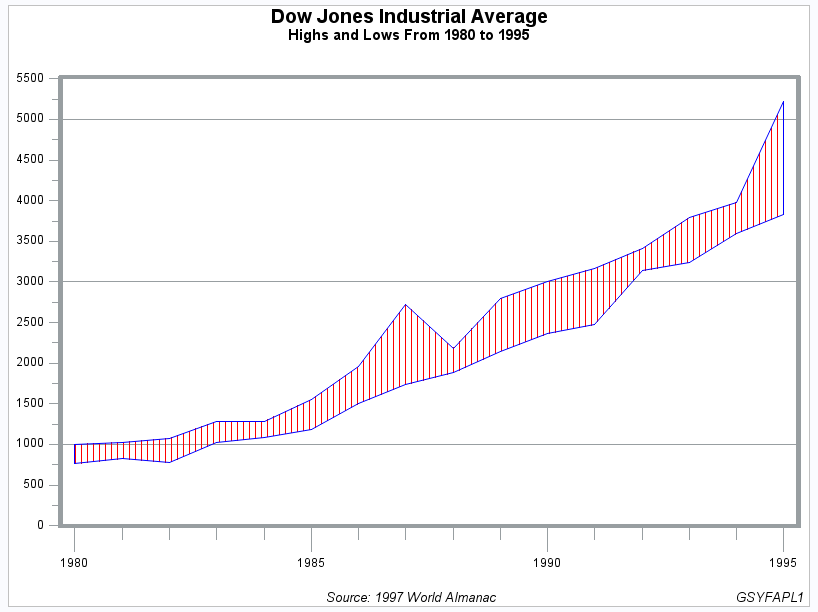
This example shows how
to fill the area between two plot lines by concatenating two data
sets into one to form a polygon with the data points. It uses a SYMBOL
statement to specify a pattern to fill the polygon and to determine
the color of the area fill and the outline around the area.
The example plots yearly
highs and lows for the Dow Jones Industrial Average. It separates
the dependent variables HIGH and LOW to produce an upper plot line
and a lower plot line. The dependent variable is named VALUE and the
independent variable is named YEAR. When concatenated into one data
set, AREA, the data sets form the polygon.
Program
goptions reset=all border;
data stocks;
   input year @7  hdate date9. @17 high
              @26 ldate date9. @36 low;
   format hdate ldate date9.;
   datalines;

1980  20NOV1980 1000.17  21APR1980  759.13
1981  27APR1981 1024.05  25SEP1981  824.01
1982  27DEC1982 1070.55  12AUG1982  776.92
1983  29NOV1983 1287.20  03JAN1983 1027.04
1984  06JAN1984 1286.64  24JUL1984 1086.57
1985  16DEC1985 1553.10  04JAN1985 1184.96
1986  02DEC1986 1955.57  22JAN1986 1502.29
1987  25AUG1987 2722.42  19OCT1987 1738.74
1988  21OCT1988 2183.50  20JAN1988 1879.14
1989  09OCT1989 2791.41  03JAN1989 2144.64
1990  16JUL1990 2999.75  11OCT1990 2365.10
1991  31DEC1991 3168.83  09JAN1991 2470.30
1992  01JUN1992 3413.21  09OCT1992 3136.58
1993  29DEC1993 3794.33  20JAN1993 3241.95
1994  31JAN1994 3978.36  04APR1994 3593.35
1995  13DEC1995 5216.47  30JAN1995 3832.08
;
data high(keep=year value)
     low(keep=year value);
   set stocks;
   value=high; output high;
   value=low; output low;
run;
proc sort data=low;
   by descending year;
run;
data area;
   set high low;
run;
title1 "Dow Jones Industrial Average";
title2  "Highs and Lows From 1980 to 1995";
footnote " Source: 1997 World Almanac"
         j=r "GSYFAPL1 ";
symbol interpol=m3n90
       cv=red
       co=blue;
axis1 order=(1980 to 1995 by 5)
      label=none
      major=(height=2)
      minor=(number=4 height=1)
      offset=(2,2)
      width=3;
axis2 order=(0 to 5500 by 500)
      label=none
      major=(height=1.5)  offset=(0,0)
      minor=(number=1 height=1);
proc gplot data=area;
   plot value*year / haxis=axis1
                     vaxis=axis2
                     vref=(1000 3000 5000);
run;
quit;
Program Description
Create the data set. STOCKS
contains yearly highs and lows for the Dow Jones Industrial Average,
and the dates of the high and low values each year.
data stocks;
   input year @7  hdate date9. @17 high
              @26 ldate date9. @36 low;
   format hdate ldate date9.;
   datalines;

1980  20NOV1980 1000.17  21APR1980  759.13
1981  27APR1981 1024.05  25SEP1981  824.01
1982  27DEC1982 1070.55  12AUG1982  776.92
1983  29NOV1983 1287.20  03JAN1983 1027.04
1984  06JAN1984 1286.64  24JUL1984 1086.57
1985  16DEC1985 1553.10  04JAN1985 1184.96
1986  02DEC1986 1955.57  22JAN1986 1502.29
1987  25AUG1987 2722.42  19OCT1987 1738.74
1988  21OCT1988 2183.50  20JAN1988 1879.14
1989  09OCT1989 2791.41  03JAN1989 2144.64
1990  16JUL1990 2999.75  11OCT1990 2365.10
1991  31DEC1991 3168.83  09JAN1991 2470.30
1992  01JUN1992 3413.21  09OCT1992 3136.58
1993  29DEC1993 3794.33  20JAN1993 3241.95
1994  31JAN1994 3978.36  04APR1994 3593.35
1995  13DEC1995 5216.47  30JAN1995 3832.08
;data high(keep=year value)
low(keep=year value);
set stocks;
value=high; output high;
value=low; output low;
run;title1 "Dow Jones Industrial Average";
title2 "Highs and Lows From 1980 to 1995";
footnote " Source: 1997 World Almanac"
j=r "GSYFAPL1 ";Define symbol characteristics. The
INTERPOL= option specifies a map or a plot pattern to fill the polygon
formed by the data points. The pattern consists of medium-density
parallel lines at 90 degrees. The CV= option colors the pattern fill.
The CO= option colors the outline of the area. (If the CO= option
is not used, the outline is the color of the area.)