Examples: Generating Static Graphics
About These Examples
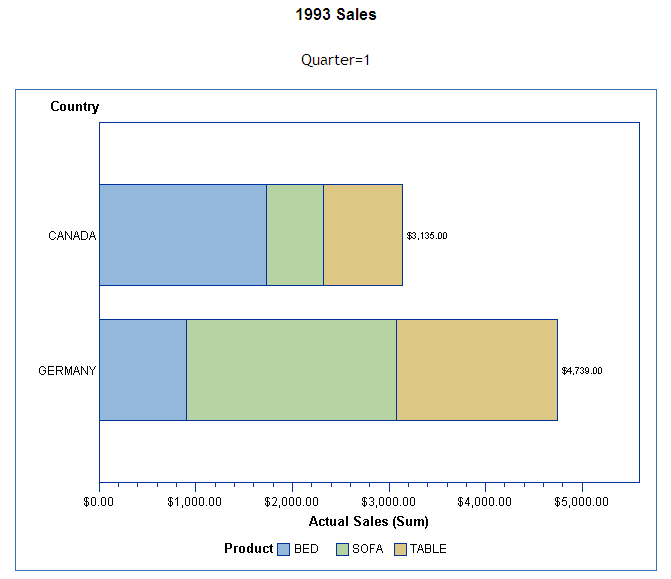
Example: Using the ACTXIMG Device
Here is an example that
uses the ODS HTML destination to create an HTML file that references
four PNG files that are created by the GCHART procedure with the DEVICE=ACTXIMG
graphics option. Because the ACTXIMG device invokes an SAS/GRAPH ActiveX Control, you can run this
example only in a Windows environment.
The GCHART procedure
in this example uses BY-group processing to display the results of
each of the four quarters of the year. Consequently, the procedure
produces four separate PNG files. Only the first graph is shown here.
To see all of the PNG images in the output, you must scroll down the
page in your browser.
The following is the
complete SAS code for this example. In this example, the output files
are sent to the default location. If you want to send the output files
to a different location, add the BODY= option to the ODS HTML statement
to specify the new location of the output files. You can specify the
complete path and filename with the BODY= option (or the FILE= option,
which is the same), or you can specify the path separately using
the PATH= option, and just the filename with the FILE= or BODY= option.
If you want to send the PNG files to a separate location, add the
GPATH= option to the ODS HTML statement to specify the new location
for the PNG files.
 /* Create data set from sashelp.prdsale */
data prdsummary;
  set sashelp.prdsale;
  where year=1993 and (country = "GERMANY" or country = "CANADA")
        and region="EAST" and division="CONSUMER" and
        (product="SOFA" or product="TABLE" or product="BED");
run;

/* Sort the data set by quarter */
proc sort data=work.prdsummary;
    by quarter;
run;

/* Specify the SEASIDE style for the HTML output */
ods html style=seaside;

/* Specify device as actximg */
goptions reset=all device=actximg border;

title1 "1993 Sales";

/* Chart total 1993 sales for each country by quarter */
proc gchart data=work.prdsummary;
   hbar country / sumvar=actual subgroup=product sum;
   by quarter;
run;
quit;

/* Close ODS HTML and then reopen it to restore the default style. */
ods html close;
ods html;
Example: Generating PNG Output
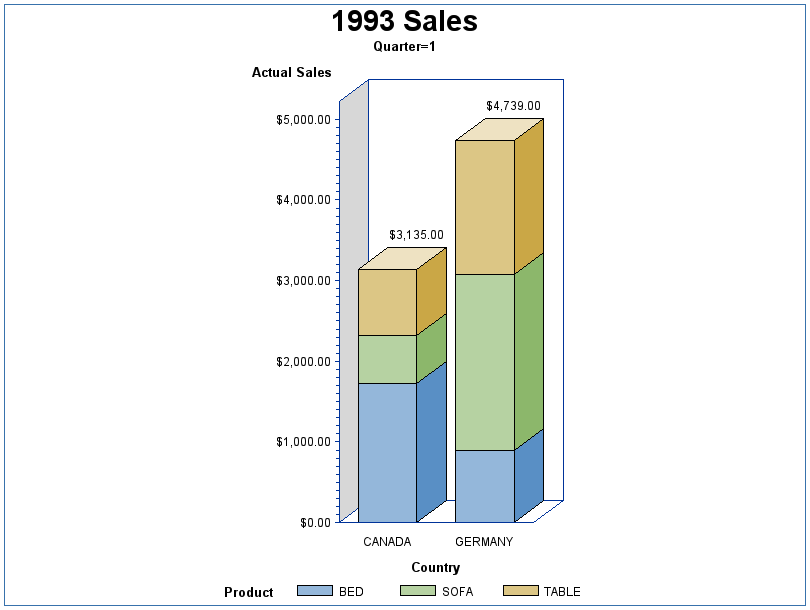
Here is an example that
uses ODS to create an HTML file that references four PNG files that
are created by a SAS/GRAPH procedure. The GCHART procedure in this example uses BY-group processing
to display the results of each of the four quarters of the year. Consequently,
the procedure produces four separate PNG files. Only the first graph
is shown here. To see all of the graphs, you must scroll down the
page in your browser.
The following is the
complete SAS code for this example. In this example, the output files
are sent to the default location. If you want to send the output files
to a different location, add the BODY= option to the ODS HTML statement
to specify the new location of the output files. You can specify the
complete path and filename with the BODY= option (or the FILE= option,
which is the same), or you can specify the path separately using
the PATH= option, and just the filename with the FILE= or BODY= option.
See SAS Output Delivery System: User's Guide for information about the ODS HTML statement.
If you want to send
the PNG files to a separate location, add the GPATH= option to the
ODS HTML statement to specify the new location for the PNG files.
/* Create data set from sashelp.prdsale */
data prdsummary;
    set sashelp.prdsale;
    where year=1993 and (country = "GERMANY" or country = "CANADA")
        and region="EAST" and division="CONSUMER" and
        (product="SOFA" or product="TABLE" or product="BED");
run;
/* Sort the data set by quarter */
proc sort data=work.prdsummary;
    by quarter;
run;
ods html style=seaside;
goptions reset=all border;
title1 "1993 Sales";
proc gchart data=prdsummary(where=(year=1993));
    vbar3d country / sumvar=actual subgroup=product sum;
    by quarter;
run;
quit;
ods html close;
ods html;Example: GIF Output with Drill-Down Links
(See also Enhancing Web Presentations with Chart Descriptions, Data Tips, and Drill-Down Functionality.)
In
this example, the DEVICE=GIF graphics option generates image output
files and the ODS HTML statement generates an HTML output file. The
URL= option identifies a link variable that provides drill-down URLs.
The values of the link variables are added to the data set with IF/THEN
statements. ODS inserts the drill-down URLs into an image map that
it generates in the HTML output file. Because the link variable contains
the URL string only, the URL= option must be used to identify the
link variable. The HTML= option cannot be used in this case.
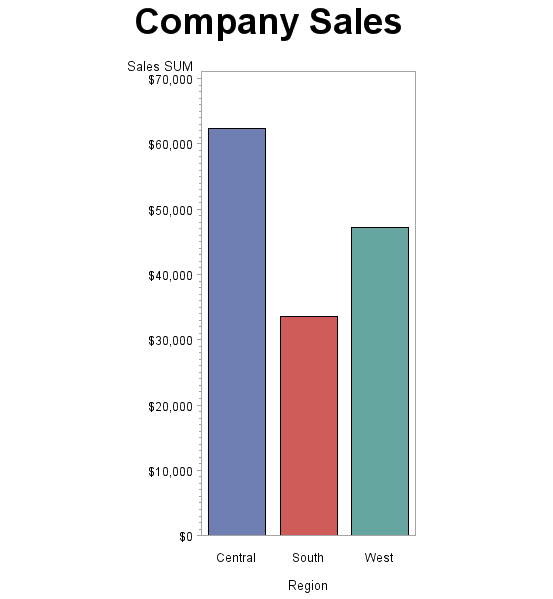
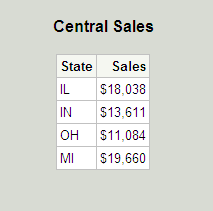
If you click one of
the three blocks in the chart, you see a table of the data for that
block. For example, if you click the Central block, the following
table is displayed.
Here is the example
code, which is available in the SAS Sample Library under the name
GWBDRILL:
 /* Close the current ODS HTML destination. */
ods html close;

 /* Set graphic options. */
goptions reset=all border device=gif;

 /* Create the data set REGSALES. */
data regsales;
   length Region State $ 8;
   format Sales dollar8.;
   input Region State Sales;

 /* Initialize the link variable. */
   length rpt $40;

/* Assign values to the URL variable. */
if Region="Central" then
     rpt="central.html";
   else if Region="South" then
     rpt="south.html";
   else if Region="West" then
     rpt="west.html";

   datalines;
West CA 13636
West OR 18988
West WA 14523
Central IL 18038
Central IN 13611
Central OH 11084
Central MI 19660
South FL 14541
South GA 19022
;

 /* Open the HTML destination for ODS output. Specify the */
 /* filename in BODY=.       */

ods html body="company.html" style=statistical;

 /* Create a chart that uses the link variable.  */
title1 "Company Sales";
proc gchart data=regsales;
   vbar region / sumvar=sales
   patternid=midpoint
   url=rpt; /* Set the URL variable to rpt */
run;
quit;

 /* Create the Central sales page */
ods html body="central.html";

title1 "Central Sales";
proc print data=regsales noobs;
   var state sales;
   where region="Central";
run;
quit;

/* Create the Southern sales page */
title1 "Southern Sales";

ods html body="south.html";

proc print data=regsales noobs;
   var state sales;
   where region="South";
run;
quit;

/* Create the Western sales page */
title1 "Western Sales";
ods html body="west.html";

proc print data=regsales noobs;
   var state sales;
   where region="West";
run;
quit;

 /* Close ODS HTML to close the output file, and then reopen ODS HTML. */

ods html close;
ods html;