GINSIDE Procedure

Example 2: Mapping and Annotating Values from the GINSIDE Procedure
| Features: |
ID statement |
| Sample library member: | GINSIDE |
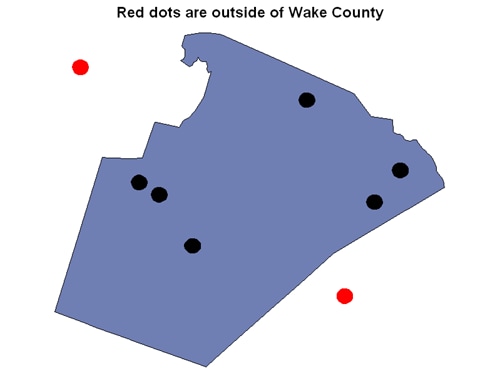
The following example
determines which customers are inside Wake County in the state of
North Carolina. It then draws a map and colors the dots (representing
customers) to distinguish customers inside the county from customers
outside the county. This example is featured in the SAS Sample Library
under the name GINSIDE.
PROC PRINT Results for Output Data Set shows the results of PROC PRINT. Notice that the last
two observations have missing values for COUNTY because they are not
in Wake County.
PROC PRINT Results for Output Data Set
           x            y  SEGMENT  STATE  COUNTY  DENSITY  city         lastname   zip

   -.001541863  -.001337842     .       37     183      .     Raleigh      Smith     27611
   -.002986279  0.000506524     .       37     183      .     Morrisville  Jones     27560
   -.002444484  0.000149461     .       37     183      .     Cary         Doe       27513
   0.001531260  0.002906157     .       37     183      .     WakeForest   Short     27587
   0.003358788  -.000065627     .       37     183      .     Wendell      Phillips  27591
   0.004053657  0.000860237     .       37     183      .     Zebulon      Jackson   27597
   0.002555932  -.002802348     .        .       .      .     Clayton      Patel     27520
   -.004565994  0.003861846     .        .       .      .     Durham       White     27705
Program
goptions reset=global border;
data customer;
  length city $20;
  input lastname$ zip x y city $;

cards;
Smith    27611 1.374164 0.623436 Raleigh
Jones    27560 1.375948 0.625278 Morrisville
Doe      27513 1.375279 0.624922 Cary
Patel    27520 1.369120 0.621970 Clayton
White    27705 1.377910 0.628629 Durham
Short    27587 1.370373 0.627680 WakeForest
Phillips 27591 1.368124 0.624705 Wendell
Jackson  27597 1.367264 0.625629 Zebulon
;
data states;
  set maps.counties(where=(fipstate(state)="NC" and county=183));
run;
data combined;
  set customer states;
run;
proc gproject data=work.combined out=work.combined dupok;
  id state county;
run;

/*split the data*/
data work.states customer;
  set work.combined;
  if missing(zip) = 1 then output work.states;
  else output customer;
run;
proc ginside map=work.states data=customer out=mapout;
  id state county;
run;
/*see the resulting data*/
proc print;
run;
data points;
   set mapout;
   length function style color $ 8 position $ 1 text $ 20 ;
   retain xsys ysys "2" hsys "3" when "a" text "";
   retain rotate 360 style "solid" function "pie" position "5";
   color="black";
   size=2;
   if missing(county) then color="red";
   output;
run;
title "Red dots are outside of Wake County";
proc gmap data=states map=states anno=points;
  id county;
  choro county / coutline=black nolegend;
run;
quit;
Program Description
data customer;
  length city $20;
  input lastname$ zip x y city $;

cards;
Smith    27611 1.374164 0.623436 Raleigh
Jones    27560 1.375948 0.625278 Morrisville
Doe      27513 1.375279 0.624922 Cary
Patel    27520 1.369120 0.621970 Clayton
White    27705 1.377910 0.628629 Durham
Short    27587 1.370373 0.627680 WakeForest
Phillips 27591 1.368124 0.624705 Wendell
Jackson  27597 1.367264 0.625629 Zebulon
;
proc gproject data=work.combined out=work.combined dupok;
  id state county;
run;

/*split the data*/
data work.states customer;
  set work.combined;
  if missing(zip) = 1 then output work.states;
  else output customer;
run;
proc ginside map=work.states data=customer out=mapout;
  id state county;
run;
/*see the resulting data*/
proc print;
run;
Create an annotate data set from the points data and color
the points black if inside the map, and color them red if outside.
data points;
   set mapout;
   length function style color $ 8 position $ 1 text $ 20 ;
   retain xsys ysys "2" hsys "3" when "a" text "";
   retain rotate 360 style "solid" function "pie" position "5";
   color="black";
   size=2;
   if missing(county) then color="red";
   output;
run;
title "Red dots are outside of Wake County";