Annotate Processing Details
Order in Which Graphics Elements Are Drawn
Overview of Drawing Order
When a procedure
uses an Annotate data set, it reads and interprets the observations
one at a time, starting with the first observation and proceeding
to the last. The order of the observations in the data set determines
the order in which the graphics elements are generated. If the coordinates
of two graphics elements overlap, the graphics element produced by
an earlier observation can be overwritten by any graphics elements
that are produced by subsequent observations. As a result, graphics
elements can overlay each other and they can also overlay or be overlaid
by procedure output.
CAUTION:
Overlay
behavior is device-dependent.
Most terminals, cameras,
and some printers demonstrate overlay behavior because the process
of drawing updates pixels as each graphics element is drawn. Plotters
do not overlay the graphics elements internally before plotting; they
draw graphics elements on top of each other on the paper. The area
where graphics elements overlap shows one color bleeding through the
color that overlays it. To ensure that one graphics element overlays
another, use the WHEN variable.
Controlling the Processing with the WHEN Variable
The WHEN variable determines the order in which observations
in an Annotate data set are processed. It determines whether observations
are processed before or after output that is produced by a SAS/GRAPH
procedure. This means that Annotate graphics can be overlaid by procedure
output or can overlay procedure output. By default, Annotate graphics
are drawn before the procedure output.
In effect, you can have
two sets of Annotate graphics elements that are generated for the
same output:
Within each set, graphics
elements are drawn in the order in which they appear in the Annotate
data set and overlay each other as appropriate (on devices that demonstrate
overlay behavior). For details, see the description of the WHEN variable
on WHEN Variable.
Order of Annotate Layers
When you annotate
a graph, you create additional transparent layers that are interspersed
with the existing layers (starting from the bottom):
-
the graph background (back wall)
-
the WHEN="B" layer for all annotations except the LABEL and SYMBOL functions
-
axis frame area (chart wall)
-
the WHEN="B" layer for the LABEL and SYMBOL functions
-
the graphical data (plot points, join lines, bars, pie slices, and so on)
-
axes (axis lines, tick values, tick marks, labels)
-
the WHEN="A" layer for all annotations except the LABEL and SYMBOL functions
-
the WHEN="A" layer for the LABEL and SYMBOL functions
Using BY-Group Processing with the Annotate Facility
You can use the Annotate facility
with procedures that use BY statements to annotate each graph that
is generated with a BY statement. The Annotate graphics for each graph
are generated depending on the value of the BY variable. To use BY-group
processing with the Annotate facility, your program must meet the
following conditions:
See BY Statement for details.
Using the LIFO Stack
The FUNCTION
variable supports several programming functions that manipulate the
internal coordinates and provide other utility operations. Several
of these functions use the LIFO stack to track and set variable values.
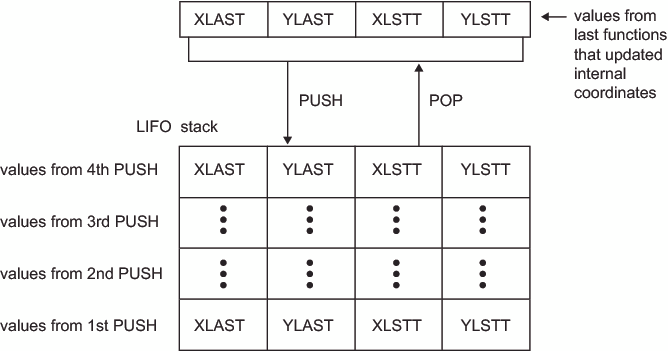
The LIFO (last-in-first-out)
stack is a storage area where you can keep internal coordinate values
for later use. It is useful when you want to save the current values
of (XLAST,YLAST) and (XLSTT,YLSTT) and use them with functions later
in the DATA step.
You store and retrieve
values from the stack using the PUSH and POP functions. The PUSH function
copies the current values of XLAST, YLAST, XLSTT, and YLSTT onto the
stack. The POP function copies values from the stack into XLAST, YLAST,
XLSTT, and YLSTT.
LIFO stacks manage the
stored data so that the last data stored in the stack is the first
data removed from the stack. This means that a POP function retrieves
the values most recently stored with a PUSH function. Using PUSH and POP to Store and Retrieve Coordinate Values illustrates how PUSH and POP functions work together.
See also Internal Coordinates.
Debugging
You can print your Annotate data
set with the PRINT procedure. This is an easy way to examine the Annotation
that you have specified or to debug your program. For example, a listing
such as the one in Listing of the Annotate Data Set TRIANGLE provides complete information about
the value that you specify for each variable in every observation.
For more complex problems,
the DEBUG function enables you to display the values of Annotate variables
and internal coordinates before and after a function is submitted.
The values are written to the SAS log.