Examples: Writing Graphs to a PDF File
About These Examples
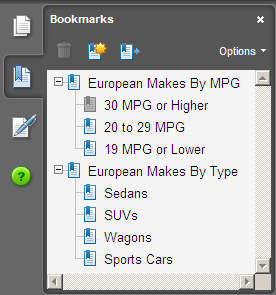
Example: Writing Graphs to a PDF File That Contains Bookmarks and Metadata
Here is an example that
writes a multipage PDF document to file EuropeanCars.pdf. The document
contains two sets of graphs that show information about European cars
and car makers. The first set of graphs shows the number of models
that each car maker produces that fall within the following ranges
of fuel efficiency in highway miles per gallon (MPG):
The second set of graphs
shows the total number of models of the following vehicle types: sedans,
SUVs, wagons, and sports cars. RUN-GROUP processing is used to generate
all of the graphs. Each page displays a single bar chart and is set
up for A4 paper with a 1 cm right, left, and bottom margin, and a
2 cm top margin. For the first set of graphs, the page orientation
for each graph is set as shown in the following table.
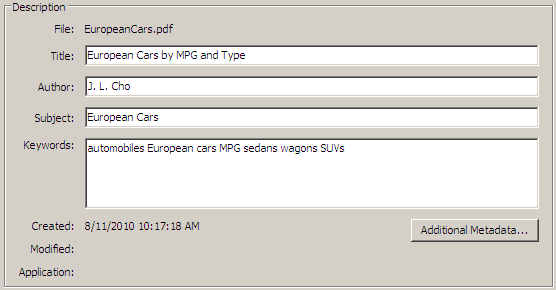
The document also contains
bookmarks and metadata. The PROCLABEL= ODS option is used to set the
text of the top-level bookmark heading for each graph set. The DESCRIPTION=
option is used with each procedure to set the text of each subheading
bookmark. The document metadata includes the following:
Here is the SAS program
for this example.
/* Close the HTML destination */
ods html close;

/* Reset the graphics options  */
goptions reset=all;

/* Modify the PDF page properties. These options must
   be set before the ODS PDF statement is executed. */
options
   papersize=A4
   leftmargin=1cm
   rightmargin=1cm
   bottommargin=1cm
   topmargin=2cm;

/* Open the PDF destination */
ods pdf style=seaside
   file="EuropeanCars.pdf"  /* Output filename */
   compress=0          /* No compression */
   /* Add metadata */
   author="J. L. Cho"
   subject="European Cars"
   title="European Cars by MPG and Type"
   keywords="automobiles European cars MPG sedans wagons SUVs";

/* Create a data set of European cars from SASHELP.CARS */
proc sort data=sashelp.cars(where=(origin="Europe")) out=europeancars;
   by make type mpg_highway;
run;

/* Create the axes */
axis1 label=(angle=90 "Number of Models Rated at Specified MPG Highway");
axis2 label=(angle=90 "Number of Models of Specified Type");
run;

/* Set the top-level bookmark for the first set of graphs */
ods proclabel="European Makes By MPG";

/* Create the first set of graphs */
proc gchart data=europeancars;
   vbar Make / name="HighMPG"
      raxis=axis1 autoref clipref cref=lightgray lautoref=33
      description="30 MPG or Higher"; /* Set subheading text */
      title1 "30 MPG or Higher";
      where MPG_Highway >= 30;
   run;
   options orientation=LANDSCAPE; /* Display LANDSCAPE */
   vbar Make / name="MedMPG"
      raxis=axis1 autoref clipref cref=lightgray lautoref=33
      description="20 to 29 MPG"; /* Set subheading text */
      title1 "20 to 29 MPG";
      where MPG_Highway < 30 and MPG_Highway >= 20;
   run;
   options orientation=PORTRAIT; /* Display PORTRAIT */
   vbar Make / name="LowMPG"
      raxis=axis1 autoref clipref cref=lightgray lautoref=33
      description="19 MPG or Lower"; /* Set subheading text */
      title1 "19 MPG or Lower";
      where MPG_Highway < 20;
   run;
quit;

/* Set the top-level bookmark for the second set of graphs */
ods proclabel="European Makes By Type";

/* Create the second set of graphs */
proc gchart data=europeancars;
   options orientation=LANDSCAPE; /* Display LANDSCAPE */
   vbar Make / name="Sedans"
      raxis=axis2 autoref clipref cref=lightgray lautoref=33
      description="Sedans"; /* Set subheading text */
      title1 "Sedans";
      where Type = "Sedan";
   run;
   options orientation=PORTRAIT; /* Display PORTRAIT */
   vbar Make / name="SUVs"
      raxis=axis2 autoref clipref cref=lightgray lautoref=33
      description="SUVs"; /* Set subheading text */
      title1 "SUVs";
      where Type="SUV";
   run;
   vbar Make / name="Wagons"
      raxis=axis2 autoref clipref cref=lightgray lautoref=33
      description="Wagons"; /* Set subheading text */
      title1 "Wagons";
      where type="Wagon";
   run;
   vbar Make / name="Sports"
      raxis=axis2 autoref clipref cref=lightgray lautoref=33
      description="Sports Cars"; /* Set subheading text */
      title1 "Sports Cars";
      where type="Sports";
   run;
quit;

/* Close the PDF destination and open the HTML destination */
ods pdf close;
ods html;

/* Reset options, titles, and footnotes */
goptions reset=all;
title;
footnote;
The document metadata
is displayed on the Description tab of the Document Properties dialog box. To open the Document Properties dialog box, type CTRL-D anywhere
in the PDF viewer window or right-click in the PDF viewer window,
and then select Document Properties from
the pop-up menu. The following figure shows the document metadata
that is displayed for this example.
Example: Writing Multiple Graphs to a One-Page, PDF/A-1b-Compliant File
Here is an example that
creates the PDF/A-1b-compliant file FourVbars.pdf, which contains
four vertical bar charts on one page. The graphs show the average
sales of sofas, chairs, desks, and beds in Canada by province. The
PRINTER=PDFA ODS option is used to create a PDF file that is compliant
with PDF/A-1b standards. To create a standard Version 1.4 PDF file,
remove the PRINTER=PDFA option from the ODS statement. The STARTPAGE=NEVER
ODS option is used to prevent a page break from being inserted between
each graph. The HORIGIN= and VORIGIN= graphics options are used to
position each graph on the page. Here is the SAS code for this example.
/* Close the HTML destination */
ods html close;

/* Set page options */
options orientation=portrait rightmargin=0.1in leftmargin=0.1in;
goptions reset=all ftext="Helvetica/bold";

/* Create the axes */
axis1 label=(angle=90 "Average Sales"); /* Left-side graph Y axis */
axis2 label=none;         /* Right-side graph Y axis */
axis3 label=("Province"); /* Midpoint axis */

/* Open PDF */
ods pdf style=printer
    notoc
    printer=pdfa         /* Create an archivable PDF */
    file="FourVbars.pdf" /* Output filename */
    startpage=never;     /* Do not insert a pagebreak after each graph */

/* Size each graph 4in x 4in */
goptions hsize=4in vsize=4in;

/* Generate the graphs */
proc gchart data=sashelp.prdsal3;
   /* Format the sales values */
   format Actual comma5.0;

   /* Create the Sofas graph in the top-left quadrant */
   title1 "Average Sales of Sofas";
   goptions horigin=0in vorigin=5in;
   vbar State / sumvar=Actual type=mean
      autoref clipref raxis=axis1 maxis=axis3;
      where product="SOFA" and country="Canada";
   run;

   /* Create the Chairs graph in the top-right quadrant */
   title1 "Average Sales of Chairs";
   goptions horigin=4.2in vorigin=5in;
   vbar State / sumvar=Actual type=mean
      autoref clipref raxis=axis2 maxis=axis3;
      where product="CHAIR" and country="Canada";
   run;

   /* Create the Desks graph in the bottom-left quadrant */
   title1 "Average Sales of Desks";
   goptions horigin=0in vorigin=0in;
   vbar State / sumvar=Actual type=mean
      autoref clipref raxis=axis1 maxis=axis3;
      where product="DESK" and country="Canada";
   run;

   /* Create the Beds graph in the bottom-right quadrant */
   title1 "Average Sales of Beds";
   goptions horigin=4.2in vorigin=0in;
   vbar State / sumvar=Actual type=mean
      autoref clipref raxis=axis2 maxis=axis3;
      where product="BED" and country="Canada";
   run;
quit;

/* Close PDF and reopen ODS HTML */
ods pdf close;
ods html;

/* Reset graphics options and titles */
goptions reset=all;
title;
Example: Writing a Drill-Down Graph to a PDF File
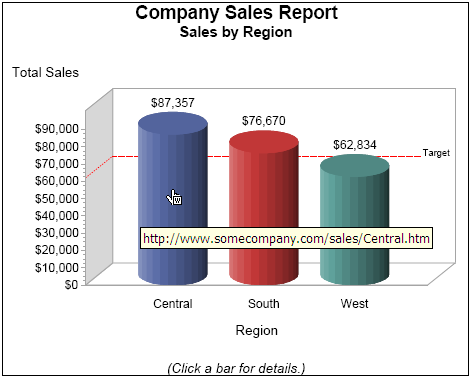
Here is an example that
exports a drill-down graph to a PDF file. This example writes a top-level
drill-down graph to a PDF file, and then writes the drill-down target
graphs to HTML files. The top-level drill-down graph in the PDF file
shows the total sales in three regions in which a company operates.
A reference line indicates a sales target of $62,000 for each region.
Each region bar in the graph is linked to a graph that breaks down
the sales data for that region. When the mouse pointer is positioned
on a bar, a data tip shows the URL to the drill-down graph. An example
is shown in the following figure.
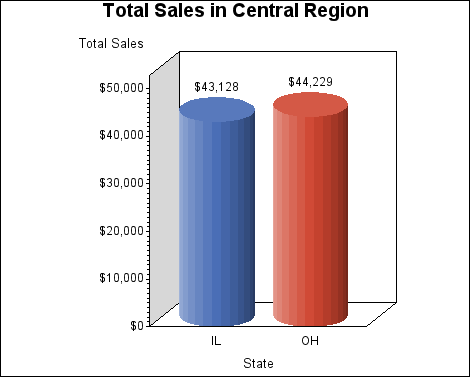
The drill-down graphs
consist of one HTML file for each region: Central.htm, South.htm,
and West.htm. Each HTML file contains a graph that breaks down the
total sales data by state for that region. When you left-click a bar
in the top-level graph, the HTML file to which that bar is linked
appears in your Web browser. In this example, if you click the Central
bar, the Central.htm file is opened, which displays the following
graph in your Web browser.
/* Define the PDF output filename. */ filename outp "salesrpt_single_page.pdf"; /* Define the ODS output path. */ filename odsout "."; /* Define the base URL for the links. */ %let baseurl=.; /* Create the data set REGSALES. */ data regsales; length Region State $ 8 Location $ 15; format Sales dollar8.; input State Region Location Sales; datalines; IL Central EVANSTON 18038 IL Central CHICAGO 14322 IL Central AURORA 10768 OH Central COLUMBUS 13611 OH Central DAYTON 11084 OH Central CINCINNATI 19534 FL South MIAMI 14541 FL South TAMPA 16733 NC South RALEIGH 19022 NC South WILMINGTON 12876 NC South CHARLOTTE 13498 CA West SANTA-CRUZ 13636 CA West LONG-BEACH 15687 WA West SEATTLE 18988 WA West TACOMA 14523 ; /* Add the link information to the data. */ data regsales; set regsales; length RPTR $ 80; if (Region="Central") then RPTR="&baseurl./Central.htm"; else if (Region="South") then RPTR="&baseurl./South.htm"; else if (Region="West") then RPTR="&baseurl./West.htm"; else RPTR=.; run; /* Close the HTML destination and set the graphics options. */ ods html close; goptions reset=all device=png border xpixels=520 ypixels=450; /* Clear titles and footnotes */ title; footnote; /* Create a macro to use for generating the region charts. */ %macro do_region(region); /* Open ODS HTML destination. Use the region name as the filename */ ods html file="®ion..htm" path=odsout style=listing; /* Set the axis label and title */ axis1 label=("Total Sales"); title1 "Total Sales in ®ion Region"; /* Create the chart */ proc gchart data=regsales; vbar3d state / sumvar=sales outside=sum name="region" raxis=axis1 patternid=midpoint description="Total sales for ®ion region" shape=cylinder width=15; where region="®ion"; run; quit; /* Close the ODS HTML destination */ ods html close; %mend do_region; /* Call the %DO_REGION macro for Central, South, and West. */ %do_region(Central); %do_region(South); %do_region(West); /* Open the PDF destination and set the style. */ ods pdf style=statistical; /* Set the graphics options. You must use the PDF or PDFA device. */ goptions reset=all gsfname=outp device=pdf border vorigin=2.5in horigin=0.6in vsize=550pt hsize=520pt; /* Generate the Company Sales report PDF document. */ title1 "Company Sales Report"; title2 "Sales by Region"; footnote1 "(Click a bar for details.)"; axis1 label=("Total Sales") reflabel=(j=r "Target "); proc gchart data=regsales; vbar3d region / cref=red lref=3 ref=62000 /* Draw a reference line at the */ /* sales target. */ sumvar=sales outside=sum raxis=axis1 shape=cylinder width=15 patternid=midpoint description="Company sales report" url=RPTR; /* Specify RPT as the URL variable in the data. */ run; quit; /* Close the PDF destination and open HTML */ ods pdf close; ods html; /* Reset graphics options, titles, and footnotes */ goptions reset=all; title; footnote;
In the SAS program,
notice that column RPTR is added to the data. For each observation,
RTPR is set to the URL of the appropriate report based on the value
of column REGION. Because column RPTR contains a URL string only,
it is specified in the URL= option on the drill-down chart GCHART
statement. The HTML= option cannot be used in this case.
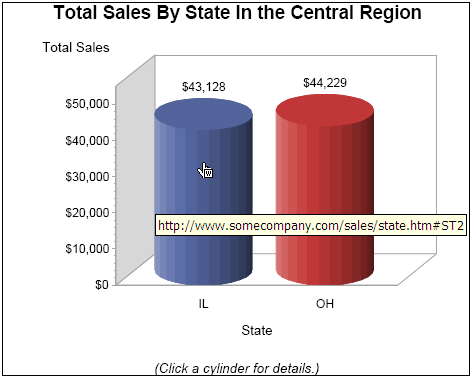
Example: Writing Multiple Drill-Down Graphs to a PDF File Using BY-Group Processing
Here is an example that
creates a PDF file that contains three drill-down graphs of sales
data. This example uses the ODS LISTING destination with the PDF device
and BY-group processing to write the top-level graphs to a PDF file.
It uses the ODS HTML destination with BY-group processing to generate
the drill-down graphs. In the PDF file, each graph shows the total
sales data by state in each of three regions: Central, South, and
West. In each of the graphs, each bar is linked to a drill-down graph
that breaks down the total sales data for that state by store location.
A data tip displays the URL to the drill-down graph as shown in the
following figure.
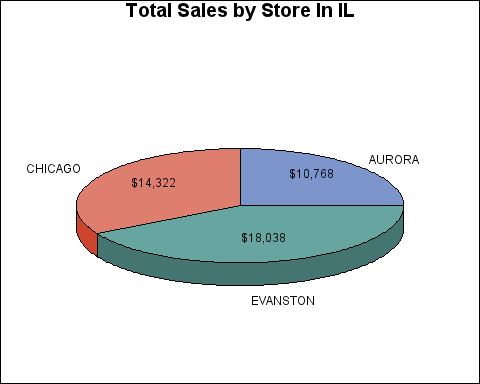
The drill-down graphs
consist of one graph for each of the following states: IL, OH, FL,
NC, CA, and WA. Each drill-down graph shows the total sales data for
a state by store location. All six of the drill-down graphs are written
to the HTML file state.htm. In the state.htm file, a named anchor
is placed at the top of each graph. The ANCHOR= option is used in
the ODS HTML statement to set the base anchor name to ST. When BY-group
processing occurs, the anchor names are assigned to each STATE value
as they occur in the data. The first name assigned is the base name,
which is ST in this example. For the subsequent names, a number is
appended to the base name to create a unique name for each STATE value.
Because the data is sorted by STATE, the anchor names are assigned
as shown in the following table.
The named anchors are
included in the URLs that link the bars in the top-level graph to
the drill-down graph in the state.htm file. The data tip shown in
the previous figure provides an example. Clicking the IL bar in this
example opens the state.htm file and positions the cursor at the IL
graph anchor (ST2) as shown in the following figure.
/* Define the PDF output filename. */
filename outp "salesrpt_multi_by.pdf";

/* Define the ODS output path. */
filename odsout ".";

/* Define the base URL for the links. */
%let baseurl=./state.htm;

 /* Create the data set REGSALES. */
data sales;
   length Region State $ 8 Location $ 15;
   format Sales dollar8.;
   input State Region Location Sales;
datalines;
CA West    SANTA-CRUZ 13636
CA West    LONG-BEACH 15687
FL South   MIAMI      14541
FL South   TAMPA      16733
IL Central EVANSTON   18038
IL Central CHICAGO    14322
IL Central AURORA     10768
NC South   RALEIGH    19022
NC South   WILMINGTON 12876
NC South   CHARLOTTE  13498
OH Central COLUMBUS   13611
OH Central DAYTON     11084
OH Central CINCINNATI 19534
WA West    SEATTLE    18988
WA West    TACOMA     14523
;
run;

/* Add the link information to the data */
data sales;
   set sales;
   length RPTS $ 80;
   if (State="CA") then RPTS="&baseurl.#ST";
   else if (State="FL") then RPTS="&baseurl.#ST1";
   else if (State="IL") then RPTS="&baseurl.#ST2";
   else if (State="NC") then RPTS="&baseurl.#ST3";
   else if (State="OH") then RPTS="&baseurl.#ST4";
   else if (State="WA") then RPTS="&baseurl.#ST5";
   else RPTS=.;
run;

/* Close the HTML destination and set the graphics options. */
ods html close;
goptions reset=all device=png border hsize=5in vsize=4in;

/* Generate the state sales charts. Use ST as the base HTML anchor
   and state.htm as the output filename. The drill-down chart links
   to this file. */
ods html file="state.htm" path=odsout anchor="ST" style=listing;
title1 "Total Sales by Store In #byval(State)";
title2;
proc gchart data=sales;
   pie3d Location / sumvar=Sales
      noheader
      slice=outside value=inside
      description="Total Sales by Store In #byval(State)";
   by State;
run; quit;
ods html close; /* Close ODS HTML. */

/* Sort the data by region. */
proc sort data=sales out=regsort;
   by Region;
run; quit;

/* Set the graphics options. You must use the PDF or PDFA device. */
goptions reset=all gsfname=outp device=pdf border
   vorigin=2.5in horigin=0.5in hsize=450pt vsize=380pt;

/* Open the PDF destination and specify the STATISTICAL style */
ods pdf style=statistical;

/* Generate the drill-down chart. */
axis1 label=("Total Sales");
title1 "Total Sales By State In the #byval(Region) Region";
footnote "(Click a bar for details.)";
proc gchart data=regsort;
   vbar3d state / sumvar=sales outside=sum name="region"
      raxis=axis1 patternid=midpoint
      shape=cylinder width=15
      url=RPTS; /* Specify RTPS as the URL variable. */
   by Region;
run; quit;

/* Close the PDF destination and open HTML */
ods pdf close;
ods html;

/* Reset graphics options, titles, and footnotes */
goptions reset=all;
title;
footnote;
Example: Writing Multiple Graphs to a PDF File Using the GREPLAY Procedure
Here is an example that
creates a sales report in both the HTML and PDF format. It first generates
the sales report in the HTML format. It then uses the GREPLAY procedure
to replay the graphs to a PDF file. The second graph in the report
is a drill-down graph in both the HTML report and the PDF report.
/* Define the HTML and PDF report output filename. */
%let outpname=salesrpt;

/* Define the ODS output path. */
filename odsout ".";

/* Define the base URL for the links. */
%let baseurl=./state.htm;

 /* Create the data set REGSALES. */
data sales;
   length Region State $ 20 Location $ 20;
   format Sales dollar8.;
   input State Region Location Sales;
datalines;
CA West    SANTA-CRUZ 13636
CA West    LONG-BEACH 15687
FL South   MIAMI      14541
FL South   TAMPA      16733
IL Central EVANSTON   18038
IL Central CHICAGO    14322
IL Central AURORA     10768
NC South   RALEIGH    19022
NC South   WILMINGTON 12876
NC South   CHARLOTTE  13498
OH Central COLUMBUS   13611
OH Central DAYTON     11084
OH Central CINCINNATI 19534
WA West    SEATTLE    18988
WA West    TACOMA     14523
;

/* Add the drill-down link information to the data. */
data sales;
   set sales;
   length RPTS $ 80;
   if (State="CA") then RPTS="&baseurl.#ST";
   else if (State="FL") then RPTS="&baseurl.#ST1";
   else if (State="IL") then RPTS="&baseurl.#ST2";
   else if (State="NC") then RPTS="&baseurl.#ST3";
   else if (State="OH") then RPTS="&baseurl.#ST4";
   else if (State="WA") then RPTS="&baseurl.#ST5";
   else RPTS=.;
run;

/* Close the HTML destination and set the graphics options. */
ods html close;
goptions reset=all device=png border xpixels=450 ypixels=450;

/* Generate the state sales charts. Use ST as the base HTML anchor, and
   state.htm as the output filename. The drill-down graph will link to
   this file. */
ods html file="state.htm" anchor="ST" style=listing;
title1 "Total Sales by Store Location";
title2;
proc gchart data=sales;
   pie3d Location / sumvar=Sales noheader;
   by State;
run; quit;
ods html close; /* Close ODS HTML. */

/* Delete the old chart GRSEGs. */
proc greplay igout=work.gseg nofs;
   delete _all_;
run; quit;

/* Set the graph size. */
goptions reset=all xpixels=550 ypixels=550;

/* Open the HTML destination to generate the HTML report. */
ods html file="&outpname..html" style=statistical;

/* Generate the region, state, and local charts. Use Region, State,
   and Location as the GRSEG names. */
axis1 label=("Total Sales");
proc gchart data=sales;
   /* Generate the Regional sales chart. */
   title1 "Total Sales by Region";
   vbar3d region / sumvar=sales outside=sum name="Region"
      raxis=axis1 patternid=midpoint shape=cylinder width=15
      description="Total Sales by Region";
run;
   /* Generate the drill-down State sales chart. */
   title1 "Total Sales by State";
   footnote "(Click a bar for details.)";
   hbar3d state / sumvar=sales sum sumlabel="Total Sales" name="State"
      patternid=midpoint raxis=axis1 shape=cylinder width=5
      description="Total Sales by State"
      url=RPTS; /* Specify the URL variable in the data. */
run;
   /* Generate the Location sales chart. */
   title1 "Total Sales by Location";
   footnote; /* Clear the footnote */
   pie location / name="Location" sumvar=sales noheading
      description="Total Sales by Location";;
run; quit;

/* Close the HTML destination. */
ods html close;

/* Set the graphics options for write to a PDF file. */
goptions device=pdf noborder;

/* Suppress the creation date and time in the PDF output. */
option nodate;

/* Create a replay template that centers that graph on the page
   and draws a navy border around each graph. */
proc greplay tc=work.tempcat nofs;
tdef newtemp
     1/llx=10 lly=20
       ulx=10 uly=80
       urx=90 ury=80
       lrx=90 lry=20
       color=navy;
     template newtemp;
quit;

/* Open the ODS PDF destination go generate the PDF report. */
ods pdf file="&outpname..pdf";

/* Replay the three sales charts to the PDF file. */
proc greplay tc=work.tempcat igout=work.gseg nofs
   template=newtemp;
   treplay 1:Region des="Total Sales by Region";
   treplay 1:State des="Total Sales by State";
   treplay 1:Location des="Total Sales by Location";
run; quit;

/* Close ODS PDF and open ODS HTML. */
ods pdf close;
ods html;

/* Reset the graphics options. */
goptions reset=all;