Units
Cells
Within the graphics
output area, SAS/GRAPH defines
an invisible grid of rows and columns. This grid
consists of character cells as shown in Rows, Columns, and Cells in the Graphics Output Area.
The size and shape of
these cells affect the size and appearance of your graph since each
graphics element is drawn using units of cells. The size and shape
of the cells are determined by the size of the graphics output area.
They are also determined by the number of rows and columns that SAS/GRAPH has defined in the grid.
You can control the number of rows by specifying the LROWS device
parameter (for a landscape orientation) or the PROWS device parameter
(for a portrait orientation). Similarly, the number of columns is
controlled by the LCOLS (landscape) or PCOLS (portrait) device parameter.
It is not recommended
that you change the number of rows and columns in the grid from the
default for your device. If you must do so, you can specify the HPOS=
and VPOS= graphics options. HPOS= overrides the value of LCOLS or
PCOLS and sets the number of columns in the graphics output area.
VPOS= overrides the value of LROWS or PROWS and sets the number of
rows in the graphics output area.
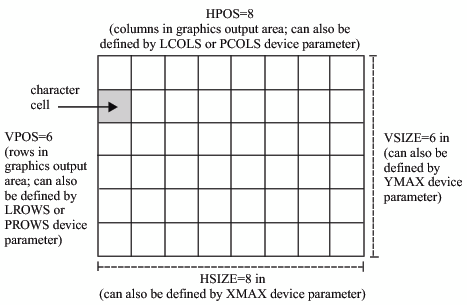
Rows, Columns, and Cells in the Graphics Output Area illustrates
how device parameter settings for the size of the output area relate
to the parameter settings for the number of character cells in the
output area.
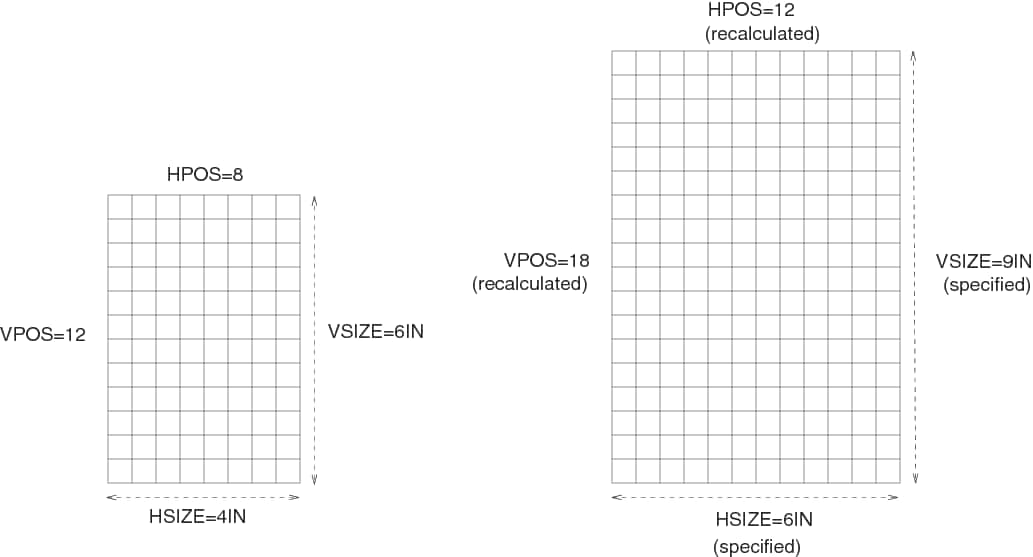
Changing only the outer dimensions
of the graphics output area (HSIZE= and VSIZE=) retains the cell size. However,
this causes SAS/GRAPH to automatically recalculate the number of rows
and columns, as illustrated in Changing HSIZE= and VSIZE= Changes Dimensions and Recalculates the Number of Rows and Columns.
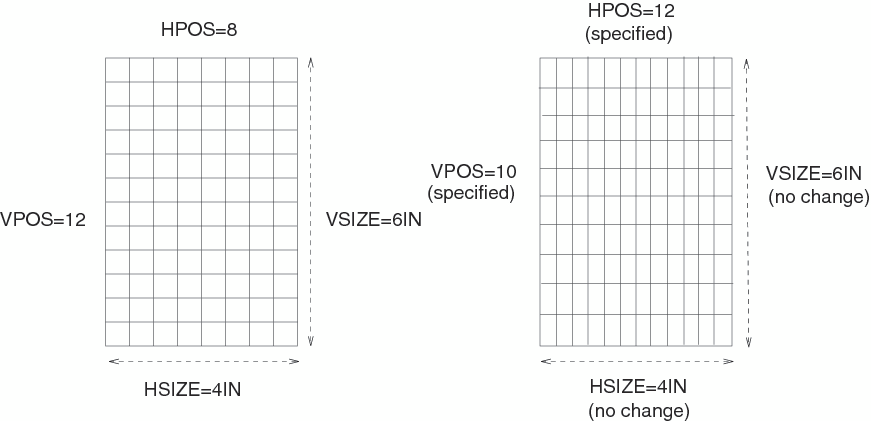
Changing only the number
of rows and columns (HPOS and VPOS) changes the size of the cells
without altering the overall size of the output. Changing HPOS= and VPOS= Changes Cell Size shows how increasing
the number of rows and columns reduces the size of the individual
cells.
Suppose you use units
of CELLS to control the size of the text in your graph while also
changing the number of rows and columns. In this case the size of
the text changes. If the cells are large (that is, HPOS= and VPOS=
have small values), the text might not fit. If the cells are too
small, the text might be too small to read. In this case, you can
adjust the size of the text with the HEIGHT= statement option or the
HTEXT= graphics option.
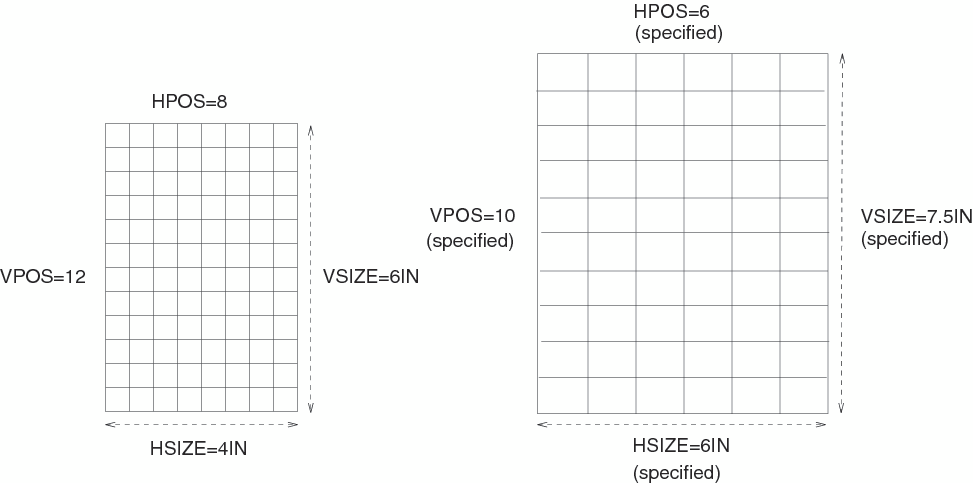
To change
all the attributes of the graphics output area, specify values for
all four options, as shown in Changing HSIZE=, VSIZE=, HPOS=, and VPOS= Changes Dimensions and the Number and Size of Cells.
Interaction of Graphics Options Affecting Cells summarizes
the interaction of the HSIZE=, VSIZE=, HPOS=, and VPOS= graphics options.
Other Units
By default, most graphics
elements are drawn using units of CELLS to determine their size. For
example, the default character height for the TITLE1 definition is
two cells; for all other text the default height is one cell.
Changing the cell size
to control the size of one element, such as text, can distort other
parts of your graph. Instead, you might want to change the type of
units that SAS/GRAPH uses
to control the size of the graphics elements. In addition to CELLS,
you can use the following units: