CNTL2TXT Function
Copies the values of the internal coordinates stored
in the variable pairs (XLAST, YLAST) to (XLSTT, YLSTT).
| Updates: | XLSTT, YLSTT |
Details
You can use CNTL2TXT
to calculate the position of labels on a graph. For example, the following
DATA step uses CNTL2TXT to position a pie slice label in the center
of the arc and just beyond the arc itself, as shown in Labeled Pie Slice.
First, use the PIE function
to draw the pie slice:
data pielabel;
retain xsys ysys "3";
length function style $ 8;
function="pie"; size=20; x=30; y=30;
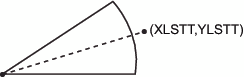
style="empty"; rotate=45; output;Then use the PIEXY function
to calculate a point outside of the arc as shown in Position Calculated with the PIEXY Function.
/* find a point that is half of the arc (rotate*.5) */
      /* and is 4 units beyond the radius (size=1.1) */
   function="piexy"; angle=rotate*.5; size=1.1; output;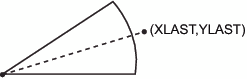
At this point, the XLAST
and YLAST variables contain the coordinates of the point that is calculated
by PIEXY. However, (XLAST, YLAST) cannot be used directly by text
functions. Use CNTL2TXT to copy the coordinates in (XLAST, YLAST)
to the XLSTT and YLSTT variables, which text functions can use.
Coordinates After Using the CNTL2TXT Function shows the results.
function="cntl2txt";
output;
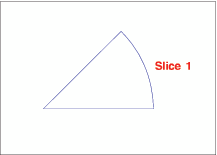
Now you can use the
LABEL function to write the label as shown in Labeled Pie Slice. Specify missing values for the X
and Y variables to force LABEL to use the XLSTT and YLSTT variables
instead of the X and Y variables.
/* write the label "Slice 1" and position it to     */
      /* the right of the point stored in XLSTT and YLSTT */
   function="label"; text="Slice 1"; angle=0; rotate=0;
      position="6"; style="swissb"; size=4; x=.; y=.;
      output;
run;
   /* draw the Annotate graphics */
proc ganno anno=pielabel;
run;
quit;