Examples: Creating Interactive ActiveX Output
About These Examples
Example: Generating an ActiveX Graph for a Microsoft Word Document
Here is an example that
demonstrates how the ODS RTF statement can be combined with the ACTIVEX
device to generate interactive graphs inside Microsoft Word files.
goptions reset=all device=activex;
ods html close;
ods rtf path="C:\" file="vehicles.rtf" style=statistical;
title "Types of Vehicles Produced Worldwide (Details)";

proc gchart data=sashelp.cars;
pie type / detail=drivetrain
    detail_percent=best
    detail_value=none
    detail_slice=best
    detail_threshold=2
    legend;
run;
quit;
ods rtf close;
ods html;
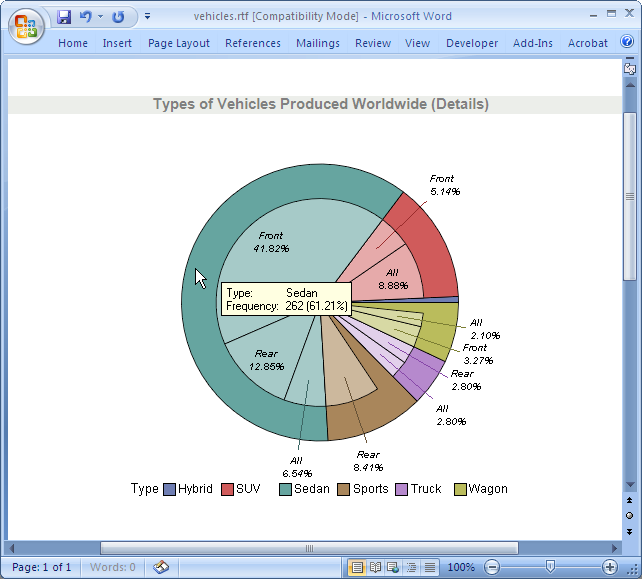
The
SAS/GRAPH ActiveX Control provides a pop-up menu
that enables you to change many aspects of the graph, including the
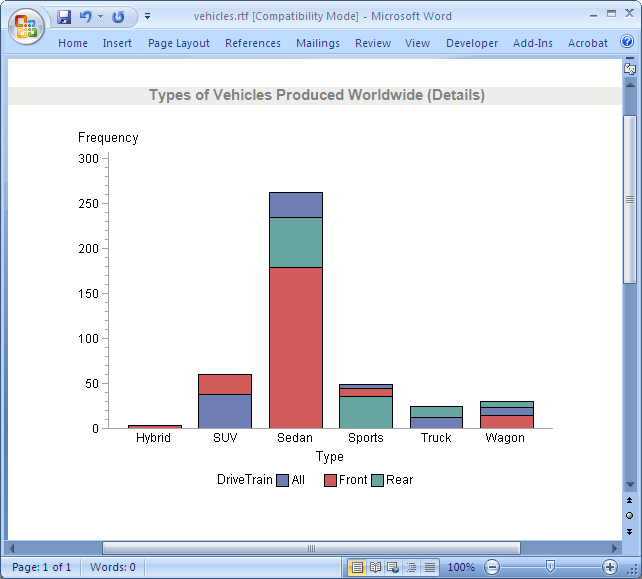
chart type. For example, to change the pie chart to a bar chart, right-click
the graph, and then select ChartType VerticalBar in the pop-up menu.
The chart changes from a pie chart to a vertical bar chart.
VerticalBar in the pop-up menu.
The chart changes from a pie chart to a vertical bar chart.
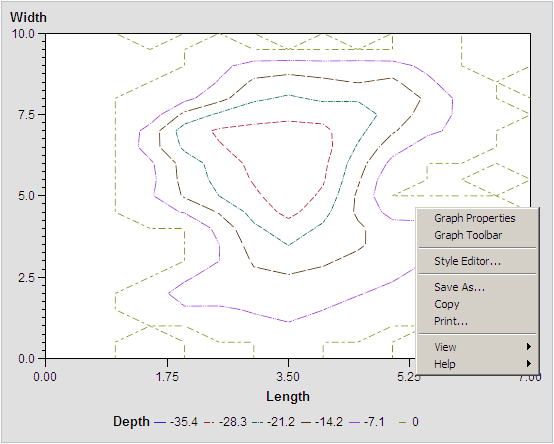
Example: Generating an Interactive Contour Plot in ActiveX
Here is an example
that displays a contour plot of water depth in a lake. The SAS/GRAPH ActiveX Control lets
you manipulate many of the aspects of the plot using the pop-up menu
that is displayed when you right-click.
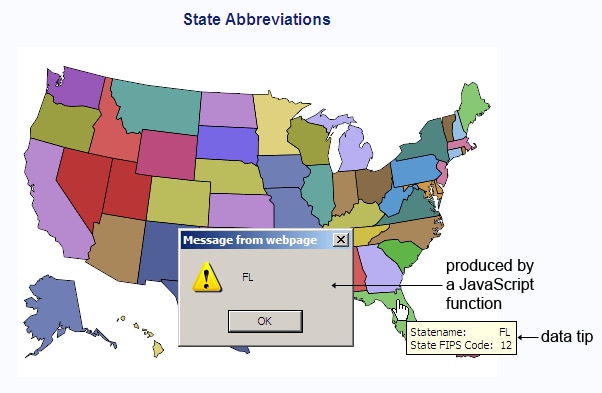
Example: Providing JavaScript Drill-Down with ActiveX
Here is an example that
shows you how to implement the Script drill-down mode using the MAP
procedure and the ACTIVEX device. By default,
SAS/GRAPH provides data tips for graphs that
are generated with the ACTIVEX device. These data tips are displayed
when the cursor is over a portion of the map. To implement JavaScript
drill-down functionality, PUT statements are used to insert JavaScript
code into the HTML file. The JavaScript, in the example, opens an
alert window that displays the state abbreviation.
 /* Change the following line to specify your output file. */
filename odsout "states.htm" ;

/* If your site has already installed the map data sets and      */
/* defined the MAPS libref, then you can delete the LIBNAME      */
/* statement below and the sample code should work.              */
/* If not, contact your on-site SAS support personnel            */
/* to determine how to define the MAPS libref.                   */
*libname maps 'SAS-MAPS-library';
/* Create a data set that contains the US states. */
proc sql;
create table work.mydata as
select unique state from maps.us;
quit;

/* Add state abbreviations to the new data set. */
data work.mydata;
 length Statename $2;
 set work.mydata;
 Statename=trim(left(upcase(fipstate(state))));
run;

/* Specify the ACTIVEX device. */
goptions reset=all device=activex;

/* Close the current ODS HTML destination. */
ods html close;

/* Open ODS HTML and specify the HTML output file, the Script  */
/* drill-down mode, and the callback method. */

ods html file=odsout
     parameters=("DRILLDOWNMODE"="Script"
                 "EXTERNALNAME"="GIDX"
                 "DRILLTARGET"="_self"
                 "DRILLFUNC"="MapDrill")
     attributes=("NAME"="GIDX");

/* Specify a map title and generate the map. */
title "State Abbreviations";
proc gmap map=maps.us data=work.mydata all;
   id state;
   choro statename / nolegend;
run;
quit;

/* Close ODS HTML to close the output file, and then reopen ODS HTML. */
ods html close;
ods html;

/* Create the MapDrill script that is specified on */
/* the ODS HTML statement's DRILLFUNC parameter.   */
/* Write the script to the same file that contains */
/* the HTML output from the GMAP procedure.        */
data _null_ ;
file odsout mod; /* modify rather than replace file */
  put " " ;
  put "<SCRIPT LANGUAGE='JavaScript'>" ;
  put "function MapDrill( appletref )" ;
  put "{" ;
  put " " ;
  put "/* Open an alert box to show the abbreviated state name. */" ;
  put "for(i = 2; i < MapDrill.arguments.length; i += 2 )" ;
  put "  {" ;
  put "    if (MapDrill.arguments[i] == 'G_DEPV,f' ) " ;
  put "        alert(MapDrill.arguments[i+1]);" ;
  put "  }" ;
  put " " ;
  put "}" ;
  put "</SCRIPT>";
run ;
Example: Providing More JavaScript Drill-Down with ActiveX
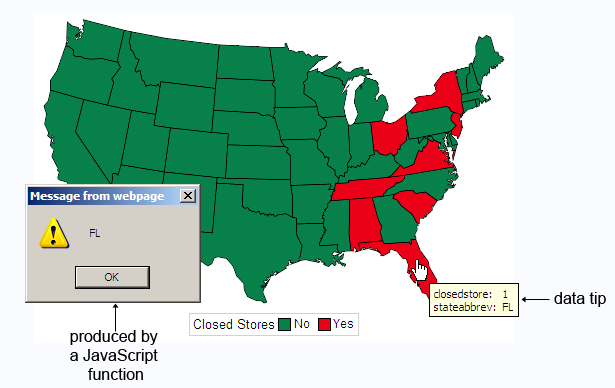
Here is an example that
is similar to the example shown in Example: Providing JavaScript Drill-Down with ActiveX but involves slightly more JavaScript coding. The program
generates a map of the United States showing the states in which stores
have been closed. If you click on a state in which no stores have
been closed, then no action is performed. If you click on a state
in which stores have been closed, a JavaScript alert window is displayed
that shows the state abbreviation. In a real application, the JavaScript
could be modified to display a list of the closed stores. This example
is available in the Sample Library under the name GWBDRAC2.
For additional information
about the script drill-down mode, see Controlling Drill-Down Behavior for ActiveX and Java Using Parameters.
 /* Change the following line to specify your output file. */
%let odsout html-output-file2.htm;

goptions reset=all device=activex;

data stores;
length stateabbrev $ 2;
input state closedstore stateabbrev $ @@;
datalines;
 1  1  AL  2  0  AK  3  0  --  4  0  AZ  5  0  AR  6  0  CA
 7  0  --  8  0  CO  9  0  CT 10  0  DE 11  0  DC 12  1  FL
13  0  GA 14  0  -- 15  0  HI 16  0  ID 17  0  IL 18  0  IN
19  0  IA 20  0  KS 21  0  KY 22  0  LA 23  0  ME 24  0  MD
25  0  MA 26  0  MI 27  0  MN 28  0  MS 29  0  MO 30  0  MT
31  0  NE 32  0  NV 33  0  NH 34  1  NJ 35  0  NM 36  1  NY
37  0  NC 38  0  ND 39  1  OH 39  1  OH 40  0  OK 41  0  OR
42  0  PA 43  0  -- 44  0  RI 45  1  SC 46  0  SD 47  1  TN
48  0  TX 49  0  UT 50  0  VT 51  1  VA 52  0  -- 53  0  WA
54  0  WV 55  0  WI 56  0  WY 57  0  -- 58  0  -- 59  0  --
60  0  AS 61  0  PQ 62  0  EQ 63  0  -- 64  0  FM 65  0  --
66  0  GU 67  0  JQ 68  0  MH 69  0  MP 70  0  PW 71  0  MQ
72  0  PR
;
run;

/* create own custom maps dataset where id is 2 letter state
abbreviation(statecode) not state fips number(state) */
data cus_map;
   length stateabbrev $2;
   set maps.us;
   stateabbrev=fipstate(state);
run;

/* close the current ODS HTML destination */
ods html close;

/* specify the ODS HTML output filename, parameters, and attributes */
ods html body="&odsout" nogtitle
      parameters=("DRILLDOWNMODE"="Script"
                         "EXTERNALNAME"="GIDX"
                         "DRILLTARGET"="_self"
                         "DRILLFUNC"="MapDrill")
      attributes=("NAME"="GIDX");

/* generate the map */
proc gmap map=cus_map(where=(state ^in(2, 15))) data=stores;
     id stateabbrev;
     choro closedstore / discrete statistic=first missing
             cempty=cx2254C2 coutline=black
     legend=legend1;
     legend1 label=("Closed Stores")
             value=(t=1 j=l 'No' t=2 j=l 'Yes') frame;
     pattern1 c=cx08804A v=solid;
     pattern2 c=cxEB0018 v=solid;
run;
quit;

/* close ODS HTML to close the output file, then reopen ODS HTML */
ods html close;
ods html;

/* add the MapDrill JavaScript function to the HTML output file */
data _null_ ;

  file "&odsout" mod;

  put "<SCRIPT LANGUAGE='JavaScript'>" ;
  put " var isclosed = null; ";
  put " var newWin; ";
  put " var stateabbrev; ";
  put " stateabbrev = ''; ";

  put "function MapDrill( appletref )" ;
  put "{" ;
  put " " ;
  put "/* Open an alert box to show the abbreviated state name. */";
  put "  for(i = 2; i < MapDrill.arguments.length; i += 2 )";
  put "  { ";
  put "    if (MapDrill.arguments[i] == 'G_DEPV,f' )
              {isclosed=MapDrill.arguments[i+1]; }";
  put "    if (MapDrill.arguments[i] == 'G_LABELV,f')
              {stateabbrev =MapDrill.arguments[i+1] + ' '; }";
  put "  } ";
  put "  if (isclosed == 1.000000){ alert(stateabbrev) }";
  put "}";

  put "</SCRIPT>";
run;