Examples: Creating Interactive Treeview Diagrams
About These Examples
Example: Treeview Diagram with XML Embedded in the HTML File
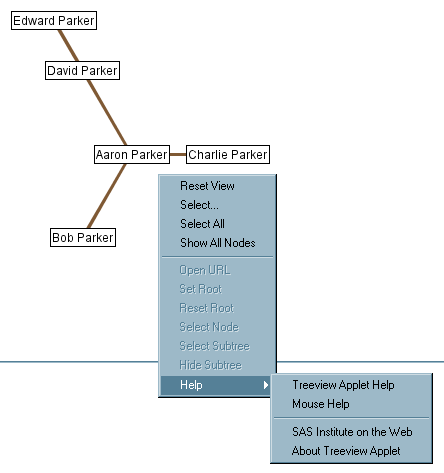
This example generates
a very simple Treeview diagram. The following figure shows the Treeview
diagram that is generated by the sample code in a Web browser. Notice
the pop-up menu, which appears when you right-click in the diagram.
Because the diagram is displayed by the Treeview applet, it is not
just a static picture. You can manipulate the diagram, for example,
by bringing selected nodes to the center, spreading out the nodes,
and searching for nodes. You can also access the Help information
for the Treeview applet. See Interactivity Enabled by the Treeview Applet.
Here is the example
program code. As you review the code, notice the following:
data father_and_sons;
input id $8. name $15. father $8.;
cards;
aaron   Aaron Parker
bob     Bob Parker     aaron
charlie Charlie Parker aaron
david   David Parker   aaron
edward  Edward Parker  david
;
run;

/* close ODS HTML and open ODS LISTING */
ods html close;
ods listing;

 /* run the macro */
%ds2tree(ndata=father_and_sons,  /* data set */
         /* specify complete url if jar files are not in same directory as
               html file */
         codebase=http://your_path_to_archive,
         xmltype=inline,
         htmlfile=your_path_and_filename.htm,
         nid=id,        /* use this variable as the id */
         cutoff=1,      /* display the name on every node */
         nparent=father,/* this identifies the parent of each node */
         nlabel=name,   /* display this on each node */
         height=400,
         width=400,
         tcolor=navy,
         fcolor=black);

/* close ODS LISTING and open ODS HTML */
ods listing close;
ods html;
Example: Treeview Diagram with XML Written to an External File
This example generates
the same Treeview as the previous example, Example: Treeview Diagram with XML Embedded in the HTML File, with the difference
that the XML is written to an external file instead of being embedded
in the HTML file. Here is the example program code. As you review
the code, notice the following:
data father_and_sons;
input id $8. name $15. father $8.;
cards;
aaron   Aaron Parker
bob     Bob Parker     aaron
charlie Charlie Parker aaron
david   David Parker   aaron
edward  Edward Parker  david
;
run;
goptions reset=all;

/* close ODS HTML and open ODS LISTING */
ods  html close;
ods listing;

 /* run the macro */
%ds2tree(ndata=father_and_sons,  /* data set */
         codebase=http://your_path_to_archive,
         htmlfile=your_path_and_filename.htm,
         xmltype=external,
         makexml=y,
         xmlurl=http://your_path_to_xml_file/weboutput_treeview2_sample.xml,
         xmlfile=your_output_path/weboutput_treeview2_sample.xml,
         nid=id,        /* as the id, use this variable specified here */
         cutoff=1,      /* display the name on every node */
         nparent=father,/* this identifies the parent of each node */
         nlabel=name,   /* display the value of this variable on each node */
         height=400,
         width=400,
         tcolor=navy,
         fcolor=black);

/* close ODS LISTING and open ODS HTML */
ods listing close;
ods html;
Example: Treeview Diagram with Hotspots
This example generates
the same Treeview as the previous example, Example: Treeview Diagram with XML Embedded in the HTML File, with the difference
that a node is associated with a URL and can be activated by a user
double-clicking the node. Here is the example program code. As you
review the code, notice the following:
data father_and_sons;
input id $8. name $15. father $8. url $30.;
cards;
aaron   Aaron Parker           http://www.sas.com
bob     Bob Parker     aaron   http://www.sas.com
charlie Charlie Parker aaron   http://www.sas.com
david   David Parker   aaron   http://www.sas.com
edward  Edward Parker  david   http://www.sas.com
;
run;

/* close ODS HTML and open ODS LISTING */
ods html close;
ods listing;

/* run the macro */
%ds2tree(ndata=father_and_sons,  /* data set */
         /* specify complete url if jar files are not in same directory as html
              file */
         codebase=http://your_path_to_archive,
         xmltype=inline,
         htmlfile=your_path_and_filename.htm,
         nid=id,        /* as the id, use the variable specified here  */
         cutoff=1,      /* display the name on every node */
         nparent=father,/* this identifies the parent of each node */
         nlabel=name,   /* display the value of this variable on each node */
         height=400,
         width=400,
         tcolor=navy,
         fcolor=black,
         nurl=url,
         driltarg=_top );

/* close ODS LISTING and open ODS HTML */
ods listing close;
ods html;