Example 10: Creating a Web Page with Drill-Down Functionality Using the ODS HTML Statement
| Features: |
|
| Data set: | TOTALS |
| Sample library member: | GONDDCW1 |
This example shows
you how to create a drill-down graph in which the user can select
an area of the graph in order to display additional information about
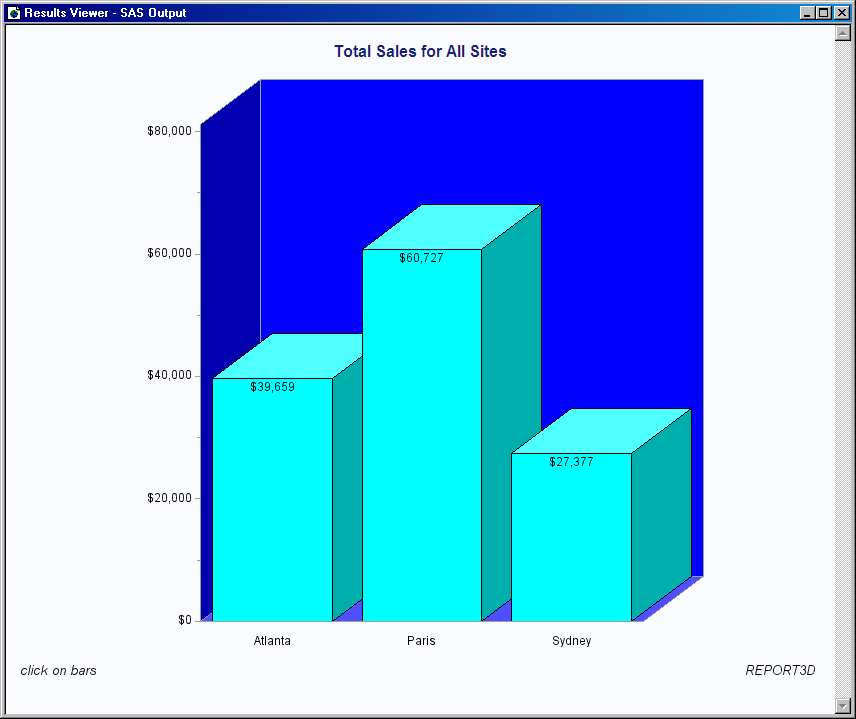
the data. The program creates one vertical bar chart of total sales
for each site and three reports that break down the sales figures
for each site by department and quarter.
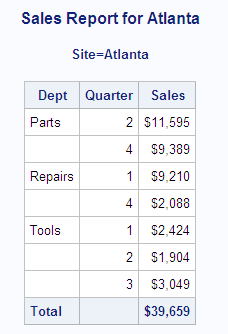
PROC REPORT Output Displayed in a Web Browser shows the PROC
REPORT output that appears when you click on the bar for Atlanta.
PROC REPORT Output Displayed in a Web Browser
Program
goptions reset=all device=gif transparency noborder;
data totals;
   length Dept $ 7 Site $ 8;
   input Dept Site Quarter Sales;
   datalines;

Repairs Sydney  1 5592.82
Repairs Atlanta 1 9210.21
Tools   Sydney  1 1775.74
Tools   Atlanta 1 2424.19
Tools   Paris   1 5914.25
Parts   Atlanta 2 11595.07
Parts   Paris   2 9558.29
Repairs Sydney  2 5505.31
Repairs Paris   2 7538.56
Tools   Atlanta 2 1903.99
Tools   Paris   2 7868.34
Parts   Sydney  3 8437.96
Parts   Paris   3 6789.85
Tools   Atlanta 3 3048.52
Tools   Paris   3 9017.96
Parts   Sydney  4 6065.57
Parts   Atlanta 4 9388.51
Parts   Paris   4 8509.08
Repairs Atlanta 4 2088.30
Repairs Paris   4 5530.37
;
data newtotal;
   set totals;
   length sitedrill $40;
if site="Atlanta" then
   sitedrill="HREF='report_deptsales.html#IDX1'";

else if site="Paris" then
   sitedrill="HREF='report_deptsales.html#IDX2'";

if site="Sydney" then
   sitedrill="HREF='report_deptsales.html#IDX3'";
run;
ods html
    body="report_body.html"
    nogtitle;
title1 "Total Sales for All Sites";
footnote1  j=l "click on bars" j=r "REPORT3D ";
pattern color=cyan;
axis1 order=(0 to 80000 by 20000)
      minor=(number=1)
      label=none;
axis2 label=none offset=(9,9);
proc gchart data=newtotal;
   format sales dollar8.;
   vbar3d site / discrete
                 width=15
                 sumvar=sales
                 inside=sum
                 html=sitedrill
                 coutline=black
                 cframe=blue
                 maxis=axis2
                 raxis=axis1
                 name="report3d ";
run;
quit;
proc sort data=newtotal;
   by site dept quarter;
run;
quit;
ods html body="report_deptsales.html" ;
goptions reset=footnote;
options nobyline;
title1 "Sales Report for #byval(site)";
ods listing;
proc report data=newtotal nowindows;
  by site;
  column site dept quarter sales;
  define site    / noprint group;
  define dept    / display group;
  define quarter / display group;
  define sales   / display sum format=dollar8.;
  compute after site;
          dept="Total";
  endcomp;
  break after site / summarize style=rowheader page;
run;
quit;
Program Description
Set the graphics environment.In
the GOPTIONS statement, DEVICE=GIF causes the ODS HTML statement to
generate the graphics output as GIF files. The TRANSPARENCY option
causes the graphics output to use the Web-page background as the background
of the graph.
Create the data set TOTALS. The
data set contains quarterly sales data for three manufacturing sites
for one year.
data totals;
   length Dept $ 7 Site $ 8;
   input Dept Site Quarter Sales;
   datalines;

Repairs Sydney  1 5592.82
Repairs Atlanta 1 9210.21
Tools   Sydney  1 1775.74
Tools   Atlanta 1 2424.19
Tools   Paris   1 5914.25
Parts   Atlanta 2 11595.07
Parts   Paris   2 9558.29
Repairs Sydney  2 5505.31
Repairs Paris   2 7538.56
Tools   Atlanta 2 1903.99
Tools   Paris   2 7868.34
Parts   Sydney  3 8437.96
Parts   Paris   3 6789.85
Tools   Atlanta 3 3048.52
Tools   Paris   3 9017.96
Parts   Sydney  4 6065.57
Parts   Atlanta 4 9388.51
Parts   Paris   4 8509.08
Repairs Atlanta 4 2088.30
Repairs Paris   4 5530.37
;
Add the HTML variable to the TOTALS data set and create
the NEWTOTAL data set. The HTML variable
SITEDRILL contains the targets for the values of the variable SITE.
Each HREF value specifies the HTML body file and the name of the anchor
within the body file that identifies the target graph.
data newtotal;
   set totals;
   length sitedrill $40;
if site="Atlanta" then
   sitedrill="HREF='report_deptsales.html#IDX1'";

else if site="Paris" then
   sitedrill="HREF='report_deptsales.html#IDX2'";

if site="Sydney" then
   sitedrill="HREF='report_deptsales.html#IDX3'";
run;
Set the ODS HTML destination for file handling options. The BODY= option names the file for storing HTML
output. The NOGTITLE option suppresses the graph titles from the SAS/GRAPH
Define axis characteristics. The
VBAR3D statement to follow assigns axis1 to the response
axis and axis2 to the midpoint axis.
Generate the vertical bar chart of total sales for each
site. The HTML= option specifies SITEDRILL
as the variable that contains the name of the target. Specifying the
HTML= option causes SAS/GRAPH
proc gchart data=newtotal;
   format sales dollar8.;
   vbar3d site / discrete
                 width=15
                 sumvar=sales
                 inside=sum
                 html=sitedrill
                 coutline=black
                 cframe=blue
                 maxis=axis2
                 raxis=axis1
                 name="report3d ";
run;
quit;
Sort the data set NEWTOTAL. The
data must be sorted in order of the BY variable before running PROC
REPORT with BY-group processing.
Suppress the default BY line and define a title that includes
the BY-value. #BYVAL inserts the value
of the BY variable SITE into the title of each report.
proc report data=newtotal nowindows;
  by site;
  column site dept quarter sales;
  define site    / noprint group;
  define dept    / display group;
  define quarter / display group;
  define sales   / display sum format=dollar8.;
  compute after site;
          dept="Total";
  endcomp;
  break after site / summarize style=rowheader page;
run;
quit;
Details
Putting It All Together
Building an HREF Value
In the DATA
step, the variable SITEDRILL is assigned a string that defines the
link target for a data value. For example,
if site="Atlanta" then
   sitedrill="HREF='report_deptsales.html#IDX1'";
The link target is specified
by the HTML HREF attribute. The HREF value tells the Web page where
to link to when a user selects the region associated with the value
Atlanta.
For example, clicking
on the first bar in the chart links to the target defined by
report_deptsales.html#IDX1.
This target consists of a filename and an anchor. The file, report_deptsales.html,
is generated by the PROC REPORT step. IDX1 is
the anchor that identifies the section of the file that contains the
report for the first BY group, Atlanta.
Creating an Image Map
The HTML= option in
the GCHART procedure is assigned the variable with the target information
– in this case, SITEDRILL.
html=sitedrill
This
option causes SAS/GRAPH
to generate (in the HTML body file) the MAP and AREA elements that
compose the image map. It loads the HREF attribute value from SITEDRILL
into the AREA element. This image map is named
gqcke00k_map.
The map is stored in report_body.html. (ODS
generates unique map names each time you run the program, so the next
time this program runs, the map name will be different): <MAP NAME="gqcke00k_map">
<AREA SHAPE="POLY"
HREF="report_deptsales.html#IDX3"
COORDS="423,409,423,242,510,242,510,409" >
<AREA SHAPE="POLY"
HREF="report_deptsales.html#IDX2"
COORDS="314,409,314,139,401,139,401,409" >
<AREA SHAPE="POLY"
HREF="report_deptsales.html#IDX1"
COORDS="205,409,205,199,292,199,292,409" >
</MAP>Referencing SAS/GRAPH Output
In the GOPTIONS statement,
DEVICE=GIF causes SAS/GRAPH
to create GIF files from the SAS/GRAPH output. It also adds to the open body file an IMG
element that points to the GIF file. In this case,
SAS/GRAPH adds the following IMG element to
report_body.html:
<IMG SRC="report3d.gif" USEMAP="#gqcke00k_map">