Examples: Creating Interactive Constellation Diagrams
About These Examples
Example: Constellation Chart with DATATYPE=ARCS
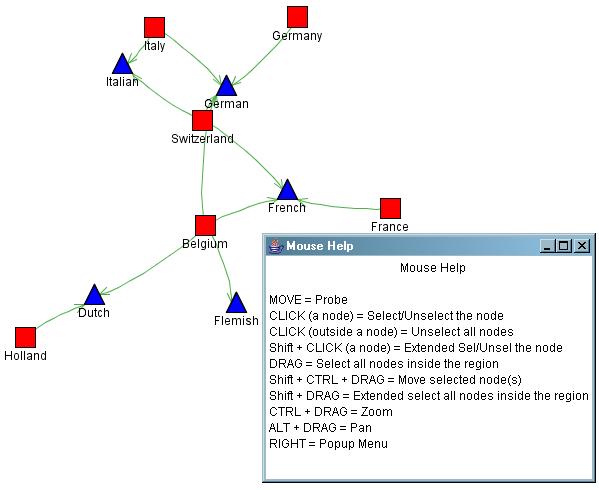
This sample program
generates a very simple Constellation diagram. It displays a number
of countries and the languages spoken in those countries. The following
is the Constellation diagram that is generated by the sample code
shown below. Notice the help window. Because the diagram is displayed
by the Constellation applet, it is not just a static picture. A user
can manipulate the diagram, for example, by moving nodes and searching
for nodes. The Mouse Help window in the following
diagram documents for the user what interactivity is available (right-click
a diagram to invoke the window).
Here is the example
program code. As you review the code, notice the following:
/* Define the path to the JAR files and the HTML output file name */
%let jarfiles = path-to-archive-files;
%let htmlfile = html-filename.htm;

/* Define a nodes data set of countries and languages  */
data nodedata;
input nodeLabel $15. shape $10. color $8. size;
cards;
France         square    red       .1
Germany        square    red       .1
Italy          square    red       .1
Belgium        square    red       .1
Switzerland    square    red       .1
Holland        square    red       .1
German         triangle  blue      .1
French         triangle  blue      .1
Italian        triangle  blue      .1
Flemish        triangle  blue      .1
Dutch          triangle  blue      .1
;
run;

/* Define a links data set */
data linkdata;
input from $15. to $15.;
cards;
France         French
Germany        German
Belgium        French
Belgium        German
Belgium        Flemish
Belgium        Dutch
Switzerland    French
Switzerland    German
Switzerland    Italian
Italy          Italian
Italy          German
Holland        Dutch
;
run;
goptions reset=all;

/* Close ODS HTML and open ODS LISTING */
ods html close;
ods listing;

/* Run the DS2CONST macro */
%ds2const(ndata=nodedata,       /* Node parameters */
          ldata=linkdata,       /* Node linkage parameters */
          datatype=arcs,        /* Use an arc list for data */
          height=400,           /* Applet window height */
          width=500,            /* Applet window width */
          code=ConstChart,      /* Class name */
          codebase=&jarfiles,   /* Path to archive file */
          htmlfile=&htmlfile,   /* HTML output file name */
          nid=nodelabel,        /* Var for node ID string */
          nlabel=nodelabel,     /* Var for node label */
          lfrom=from,           /* Var for from-node ID */
          lto=to,               /* Var for to-node ID */
          fntsize=12,           /* Node label font size */
          nshape=shape,         /* Var for node shape */
          ncolor=color,         /* Var for node color */
          nsize=size);          /* Var for node size */

/* Close ODS LISTING and open ODS HTML */
ods listing close;
ods html;
Example: Constellation Chart with DATATYPE=ASSOC
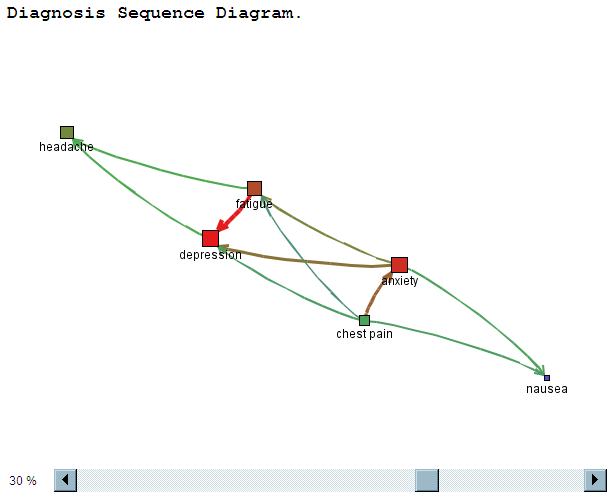
This sample program
generates a very simple Constellation diagram with DATATYPE=ASSOC.
The following figure shows Constellation diagram that is generated
by the sample code. A Constellation diagram with DATATYPE=ASSOC depicts
the strength of the relationships among variables. Variables in the
SAS data set determine the size and color of nodes, as well as the
width and color of the lines between nodes. At the bottom of the picture,
notice the slider bar which allows a user to choose how many of the
links on the diagram are displayed. Move the slider to the left, and
only the most important links are displayed. Move the slider to the
right, and all of the links are displayed.
Here is the example
program code. As you review the code, notice the following:
/* Define the path to the JAR files and the HTML output file name */
%let jarfiles = path-to-archive-files;
%let htmlfile = html-filename.htm;

/* Define the node data */
data nodedata;
length nodeID value 8 label $11 tip $25;
input nodeID value @11 label $char11. @25 tip $char25.;
cards;
0   6556  depression    depression: #6556
1   6322  anxiety       anxiety: #6322
2   5980  fatigue       fatigue: #5980
3   5286  headache      headache: #5286
4   4621  chest pain    chest pain: #4621
6   3149  nausea        nausea: #3149
;
run;

/* Define the link data */
data linkdata;
length from to linkvalue 8 tip $40;
input from to linkvalue @13 tip $char40.;
cards;
2  0  5978  #5978, Support:63.0790, Conf:99.9833
4  1  4621  #4621, Support:48.7602, Conf:100.0000
1  0  4307  #4307, Support:45.4469, Conf:68.1272
1  2  3964  #3964, Support:41.8276, Conf:62.7017
2  3  3010  #3010, Support:31.7611, Conf:50.3429
0  3  3009  #3009, Support:31.7506, Conf:47.5957
1  6  2772  #2772, Support:29.2498, Conf:43.8469
4  6  2609  #2609, Support:27.5298, Conf:56.4596
4  0  2606  #2606, Support:27.4982, Conf:56.3947
4  2  2263  #2263, Support:23.8789, Conf:48.9721
3  0  1980  #1980, Support:20.8927, Conf:40.6821
3  1  1701  #1701, Support:17.9487, Conf:34.9497
3  2  1701  #1701, Support:17.9487, Conf:34.9497
1  3  1593  #1593, Support:16.8091, Conf:25.1977
4  3  1152  #1152, Support:12.1557, Conf:24.9297
0  6  623   #623, Support:6.5738, Conf:9.8545
2  6  623   #623, Support:6.5738, Conf:10.4198
6  3  597   #597, Support:6.2995, Conf:20.0268
3  6  372   #372, Support:3.9253, Conf:7.6433
6  0  344   #344, Support:3.6298, Conf:11.5398
run;

/* Close ODS HTML and open ODS LISTING */
ods html close;
ods listing;

/* Run the ds2const macro */
title1 "Diagnosis Sequence Diagram.";
%ds2const(ndata=nodedata,        /* Node parameters */
          ldata=linkdata,        /* Node linkage parameters */
          datatype=assoc,        /* Size nodes by nvalue var  */
          minlnkwt=30,           /* Minimum link display */
          height=450,            /* Applet window height */
          width=600,             /* Applet window width */
          codebase=&jarfiles,    /* Path to archive file */
          htmlfile=&htmlfile,    /* HTML output file name */
          colormap=y,            /* Use colormap for link/node colors */
          nid=nodeID,            /* Var for node ID string */
          nlabel=label,          /* Var for node label */
          ncolval=value,         /* Var for node color */
          nsize=value,           /* Var for node size */
          fntsize=12,            /* Node label font size */
          ntip=tip,              /* Var for popup node text */
          lfrom=from,            /* Var for from-node ID */
          lto=to,                /* Var for to-node ID */
          lcolval=linkvalue,     /* Var for link colors */
          lvalue=linkvalue,      /* Var for link values */
          ltip=tip,              /* Var for popup line text */
          linktype=arrow);       /* Use arrows for links */

/* Close ODS LISTING and open ODS HTML */
ods listing close;
ods html;
Example: Constellation Chart with XML Written to an External File
This sample program
generates the same Constellation diagram as the previous example, Example: Constellation Chart with DATATYPE=ASSOC, with the difference
that the XML is written to an external file instead of being embedded
in the HTML file.
Here is the example
program code. As you review the code, notice the following:
/* Define the file paths and filenames */
%let jarfiles=path-to-archive-files; /* Path to the JAR files */
%let htmlfile = html-filename.htm;    /* HTML output file name */
%let xmlfile = xml-filename.xml;    /* XML output file name */
%let xmlurl = url-to-xml-file;      /* URL to the XML file */

/* Define the node data */
data nodedata;
length nodeID value 8 label $11 tip $25;
input nodeID value @11 label $char11. @25 tip $char25.;
cards;
0   6556  depression    depression: #6556
1   6322  anxiety       anxiety: #6322
2   5980  fatigue       fatigue: #5980
3   5286  headache      headache: #5286
4   4621  chest pain    chest pain: #4621
6   3149  nausea        nausea: #3149
;
run;

/* Define the link data */
data linkdata;
length from to linkvalue 8 tip $40;
input from to linkvalue @13 tip $char40.;
cards;
2  0  5978  #5978, Support:63.0790, Conf:99.9833
4  1  4621  #4621, Support:48.7602, Conf:100.0000
1  0  4307  #4307, Support:45.4469, Conf:68.1272
1  2  3964  #3964, Support:41.8276, Conf:62.7017
2  3  3010  #3010, Support:31.7611, Conf:50.3429
0  3  3009  #3009, Support:31.7506, Conf:47.5957
1  6  2772  #2772, Support:29.2498, Conf:43.8469
4  6  2609  #2609, Support:27.5298, Conf:56.4596
4  0  2606  #2606, Support:27.4982, Conf:56.3947
4  2  2263  #2263, Support:23.8789, Conf:48.9721
3  0  1980  #1980, Support:20.8927, Conf:40.6821
3  1  1701  #1701, Support:17.9487, Conf:34.9497
3  2  1701  #1701, Support:17.9487, Conf:34.9497
1  3  1593  #1593, Support:16.8091, Conf:25.1977
4  3  1152  #1152, Support:12.1557, Conf:24.9297
0  6  623   #623, Support:6.5738, Conf:9.8545
2  6  623   #623, Support:6.5738, Conf:10.4198
6  3  597   #597, Support:6.2995, Conf:20.0268
3  6  372   #372, Support:3.9253, Conf:7.6433
6  0  344   #344, Support:3.6298, Conf:11.5398
run;
title1 "Diagnosis Sequence Diagram.";

/* Close ODS HTML and open ODS LISTING */
ods html close;
ods listing;

%ds2const(ndata=nodedata,       /* Node parameters */
          ldata=linkdata,       /* Node linkage parameters */
          datatype=assoc,       /* Size nodes by nvalue var  */
          minlnkwt=30,          /* Minimum link display */
          height=450,           /* Applet window height */
          width=600,            /* Applet window width */
          codebase=&jarfiles,   /* Path to archive file */
          htmlfile=&htmlfile,   /* HTML output file name */
          xmltype=external,     /* Use external file for XML data */
          makexml=y,            /* Generate the XML data */
          xmlurl=&xmlurl,       /* URL to the XML file */
          xmlfile=&xmlfile,     /* Path to the XML output file */
          colormap=y,           /* Use colormap for link/node colors */
          nid=nodeID,           /* Var for node ID string */
          nlabel=label,         /* Var for node label */
          ncolval=value,        /* Var for node color */
          nsize=value,          /* Var for node size */
          fntsize=12,           /* Node label font size */
          ntip=tip,             /* Var for popup node text */
          lfrom=from,           /* Var for from-node ID */
          lto=to,               /* Var for to-node ID */
          lcolval=linkvalue,    /* Var for link colors */
          lvalue=linkvalue,     /* Var for link values */
          ltip=tip,             /* Var for popup line text */
          linktype=arrow);      /* Use arrows for links */

/* Close ODS LISTING and open ODS HTML */
ods listing close;
ods html;
Example: Constellation Chart with Hotspots
This sample program
generates the same Constellation diagram as in Example: Constellation Chart with DATATYPE=ARCS and adds hotspots
to the nodes of the diagram. Here is the example program code. As
you review the code, notice that the parameter NURL= specifies the
variable in the SAS data set that contains the URL to be linked to
when a user double-clicks the node.
/* Define the path to the archive file and the HTML output file name */
%let jarfiles = path-to-archive-files;
%let htmlfile = html-filename.htm;

/* Define a node data set of countries and languages  */
data nodedata;
input nodeLabel $15. shape $10. color $8. size url $40.;
cards;
France         square    red       .1 http://www.sas.com
Germany        square    red       .1 http://www.support.sas.com
Italy          square    red       .1 http://www.sas.com/software/
Belgium        square    red       .1 http://www.sas.com/resources/
Switzerland    square    red       .1 http://www.sas.com/success/index.html
Holland        square    red       .1 http://www.sas.com/partners/
German         triangle  blue      .1 http://www.sas.com/corporate/index.html
French         triangle  blue      .1 http://www.sas.com/start/exec.html
Italian        triangle  blue      .1 http://www.sas.com/start/it.html
Flemish        triangle  blue      .1 http://www.sas.com/start/bizman.html
Dutch          triangle  blue      .1 http://www.sas.com/presscenter/
;
run;

/* Define the link data */
data linkdata;
input from $15. to $15.;
cards;
France         French
Germany        German
Belgium        French
Belgium        German
Belgium        Flemish
Belgium        Dutch
Switzerland    French
Switzerland    German
Switzerland    Italian
Italy          Italian
Italy          German
Holland        Dutch
;
run;
goptions reset=all;

/* Close ODS HTML and open ODS LISTING */
ods html close;
ods listing;

/* Run the DS2CONST macro */
%ds2const(ndata=nodedata,       /* Node parameters */
          ldata=linkdata,       /* Node linkage parameters */
          nurl=url,             /* Var for drill-down links */
          datatype=arcs,        /* Use an arc list for data */
          height=400,           /* Applet window height */
          width=500,            /* Applet window width */
          code=ConstChart,      /* Class name */
          codebase=&jarfiles,   /* Path to archive file */
          htmlfile=&htmlfile,   /* HTML output file name */
          nid=nodelabel,        /* Var for node ID string */
          nlabel=nodelabel,     /* Var for node label */
          lfrom=from,           /* Var for from-node ID */
          lto=to,               /* Var for to-node ID */
          fntsize=12,           /* Node label font size */
          nshape=shape,         /* Var for node shape */
          ncolor=color,         /* Var for node color */
          nsize=size);          /* Var for node size */

/* Close ODS LISTING and open ODS HTML */
ods listing close;
ods html;