PIE Function
Draws pie slices in the graphics output.
| Updates: | XLAST, YLAST to coordinates for center of the slice. |
Syntax
FUNCTION='PIE';
Associated Variables
- ANGLE=starting-angle
-
specifies the starting angle of the slice arc. The default is 0.00 (horizontal) if the ANGLE variable is not specified for the first slice. After the first slice, the default is the ending angle of the slice arc just drawn if ANGLE=. (missing). Therefore, you can specify consecutive pie slices more easily by omitting the start and end calculations that are otherwise required. If you want the next slice to start at an angle that is different from the ending angle of the previous slice, you must specify a value for the ANGLE variable.
- COLOR='color'
-
specifies the color of the pie slice, if a pattern is specified in the STYLE variable. If you specify STYLE='EMPTY', the COLOR variable also specifies the outline color of the pie slices. Color can be any
SAS/GRAPH color name.
- GROUP=group-value
- MIDPOINT=midpoint-value
- SUBGROUP=subgroup-value
-
specify coordinates for HBAR and VBAR charts from the GCHART procedure. Use these variables only with the data coordinate systems 1, 2, 7, and 8.
- HSYS='coordinate-system'
-
specifies the coordinate system for the SIZE variable. See HSYS Variable for an explanation of coordinate-system.
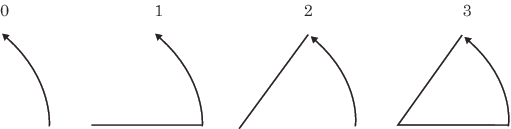
- LINE=0...3
-
specifies which slice line (or lines) to draw. See LINE Values Used with the PIE Function for line values and their actions. LINE=0 draws only the outside of the arc and enables you to draw a circle.
- ROTATE=rotation-angle
-
specifies the angle of rotation or the delta angle of the slice arc. The default is 0.00.For example, if you specify these statements, the slice arc that is drawn begins at 90 degrees (vertical) and ends at 135 degrees (90+45):
function="pie"; angle=90; rotate=45; output;
The ANGLE variable is internally updated to the end value, 135 degrees. The value is modified only internally. If a second PIE is used and the ANGLE variable contains a missing value, the start angle is assumed to be the previous end, or 135 degrees. The arc continues from that point.
- SIZE=radius
-
specifies the radius of the circle being drawn. The SIZE variable uses units that are determined by the HSYS variable.
- STYLE='fill-pattern'
-
specifies the value of the pattern that fills the pie slices. Fill-pattern can be the following pie patterns:For example, if STYLE='P5N15', a pie slice with a fill of parallel lines is produced. The fill uses the heaviest density to draw the lines, and the parallel lines are drawn at a 15-degree angle from perpendicular to the radius of the pie slice. See also the discussion of fill patterns for pie and star charts in the documentation for the VALUE= option for the PATTERN Statement.Note:Java and ActiveX support only SOLID and EMPTY. EMPTY is the default if any other value is used.
- WIDTH='line-thickness'
-
specifies the thickness of the outline around the pie slice. See WIDTH Variable.
- WHEN='B' | 'A'
-
specifies when to draw the pie slice in relation to other procedure output. See WHEN Variable.
- X=horizontal-coordinate
- Y=vertical-coordinate
- Z=depth-coordinate (PROC G3D only)
- XC='character-type-horizontal-coordinate'
- YC='character-type-vertical-coordinate'
-
define the center of the slice. The pivot point for all slices is the point referenced by X, Y, and Z (with PROC G3D only). The first PIE command that is issued sets the center at the (X,Y) value. If subsequent values for X and Y are missing, the coordinates of the center point are used.
- XSYS='coordinate-system'
-
specifies the coordinate system for the X or XC variable. Use the XC variable only with XSYS='2'. See XSYS Variable for an explanation of coordinate-system.
- YSYS='coordinate-system'
-
specifies the coordinate system for the Y or YC variable. Use the YC variable only with YSYS='2'. See YSYS Variable for an explanation of coordinate-system.
- ZSYS='coordinate-system'
-
specifies the coordinate system for the Z variable. See ZSYS Variable for an explanation of coordinate-system.