| The CASECONTROL Procedure |
| Statistical Computations |
Biallelic Markers
PROC CASECONTROL offers three statistics to test for an association between a biallelic marker and a binary variable, typically affection status of a particular disease. Table 5.1 displays the quantities that are used for the three case-control tests for biallelic markers (Sasieni 1997).
|
Number of |
|||
0 |
1 |
2 |
Total |
|
|---|---|---|---|---|
Case |
|
|
|
|
Control |
|
|
|
|
Total |
|
|
|
|
 Alleles


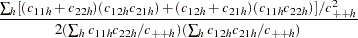
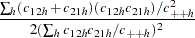
The three statistical methods for testing a marker for association with a disease locus are Armitage’s trend test (1955), the allele case-control test, and the genotype case-control test. The trend test and allele case-control test are most useful when there is an additive allele effect on the disease susceptibility. When Hardy-Weinberg equilibrium (HWE) holds in the combined sample of cases and controls, these statistics are approximately equal and have an asymptotic  distribution. However, if the assumption of HWE in the combined sample is violated, then the variance for the allele case-control statistic is incorrect; only the trend test remains valid under this violation. The statistics for the trend and allele case-control test, respectively, are given by Sasieni (1997) as
 |
 |
 |
|||
 |
|
 |
Devlin and Roeder (1999) describe a genomic control method that adjusts the trend test statistic for correlation between alleles from members of the same subpopulation. Assuming the variance inflation factor  is constant across the genome, it can be estimated by
  , where
  for the
  th biallelic marker,
  (Devlin and Roeder 1999; Bacanu, Devlin, and Roeder 2000). The adjusted trend statistic,
  , is approximately distributed as . This variance correction is made to biallelic markers when the VIF option is specified in the PROC statement. By default, any biallelic markers that are specified in the VAR statement are used in computing
  . Alternatively, the NULLSNPS= option can be used to specify biallelic markers other than those in the VAR statement to be used to calculate . This enables markers that are assumed to have no effect on disease susceptibility or to not be in linkage disequilibrium with a disease-susceptibility locus to be used in calculating the inflation factor (Bacanu, Devlin, and Roeder 2000).
If dominance effects of alleles are also suspected to contribute to disease susceptibility, the genotype case-control test can be used. The standard 2 3 contingency table analysis is used to form the
  statistic for the genotype case-control test as
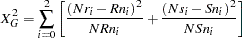 |
which tests for both additive and dominance (nonadditive) allelic effects (Nielsen and Weir 1999).
When the OR option is specified in the PROC CASECONTROL statement, odds ratios for biallelic markers are calculated based on the 22 table of allele-by-trait counts. Using the values given in Table 5.1 to form the cell counts  ,
,  ,
,  , and
, and  , the odds ratio can be estimated as
  . The asymptotic
  % confidence limits for the estimated odds ratio
  are
are
 |
where
 |
and  is the
  percentile in the standard normal distribution. If any of the four cell frequencies are zero, the limits are not computed. The order of rows and columns is determined by the formatted values of the alleles and trait. Also note that if there are no heterozygous genotypes,
  is used in place of
  in the formula for the confidence limits so that each individual is counted only once. This provides the correct limits when combining the heterozygous genotype with a homozygous genotype to obtain odds ratios for dominant or recessive disease models (see Example 5.3).
Multiallelic Markers
When there are multiple alleles of interest at a marker, the same three tests can be performed, except that Devlin and Roeder’s genomic control adjustment is not applied to any markers with more than two alleles. To construct the test statistic for the multiallelic trend test for a marker with  alleles (Slager and Schaid 2001), the
  matrix
  is created such that each element
  represents the number of times the
  allele appears in the th genotype,
  and
and  , where
  , the number of possible genotypes. Vectors
  and
and  of length
  contain the genotype counts for the cases and controls, respectively, and
  , the proportion of cases in the sample. The multiallelic trend test statistic can then be expressed as
  , where the vector
 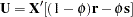 .
.  is calculated under the assumption of independent (or unrelated) subjects in the sample by using
  and
and  . These matrices contain elements
  and
and 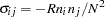 , where
  (the
(the  is replaced by
  for ). This statistic has an asymptotic
  distribution.
Another way to test for additive allele effects at the disease or trait locus is the allele case-control test, executed using a contingency table analysis similar to the genotype case-control test described in the preceding section, assuming HWE (Nielsen and Weir 1999). For a marker with alleles, a 2 contingency table is formed with one row for cases, one for controls, and a column for each allele. The statistic is formed by summing
  over all cells in the table, where
  is the observed count for the cell and
  is the expected count, the cell’s column total multiplied by
  (or
(or  ) for a cell in the case (or control) row.
The genotypic case-control test statistic is calculated in a similar manner, with columns now representing the observed genotype classes instead of alleles. Significance of this test statistic based on the  distribution indicates dominance and/or additive allelic effects on the disease or trait (Nielsen and Weir 1999).
Stratified Analysis
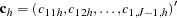
A stratified case-control test can be performed to adjust for categorical covariates, such as gender or treatment; to analyze a sample from a matched or nested case-control design; or to accommodate the analysis of X-linked markers. The generalized Cochran-Mantel-Haenszel (CMH) test statistic given by Agresti (1990) can be used to test whether there is an association between the trait and marker alleles or genotypes in any of the strata, still with the same chi-square distribution and degrees of freedom as the test statistic from the nonstratified analysis. For the allele and genotype tests, which are based on contingency tables, the statistic is formed with the following quantities that use observed cell counts  from the th row (corresponding to one of the two trait categories),
  th out of
  columns (corresponding to the th allele or genotype), and
  th stratum:
 |
 |
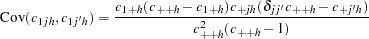 |
with covariance matrix  of
of  comprising these covariance terms for all and
 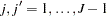 and
and  when
when  and 0 otherwise. Note that cell counts for
  are omitted from the vectors and matrix since they are completely dependent on the cell counts from the first row and column totals. For the stratified trend test, which is based on the Mantel score test of conditional independence (Agresti 1990), a trend test vector
  and the covariance matrix
  are calculated within each stratum with and
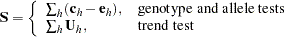
  defined as in the previous section for the multiallelic trend test. All three test statistics can then be represented as
 |
with a  distribution under the null hypothesis, where represents the number of genotypes for the genotype test or the number of alleles for the allele and trend tests,
 |
and  .
.
The Mantel-Haenszel estimate of the common odds ratio across strata (Agresti 1990) for biallelic markers is reported when the STRATA statement is used along with the OR option in the PROC CASECONTROL statement. For a contingency table with two columns representing the two alleles at a marker, the estimate in terms of the observed cell counts is
 |
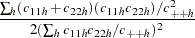
The asymptotic % confidence limits for the estimate of the odds ratio  are again given by Agresti (1990) as
 |
now with
 |
|
 |
|||
 |
 |
 |
|||
|
|
 |
Again, if all of the strata contain no heterozygous genotypes, is replaced by in the confidence limits formula.
Permutation Tests
By default, the -values from the  distribution with the appropriate degrees of freedom are reported for all three case-control tests. However, if the PERMS= option is specified in the PROC CASECONTROL statement, then Monte Carlo estimates of exact -values are computed instead using the permutation procedure. For the genotype and trend tests, new samples of individuals are formed by permuting the trait value of the individuals in the sample; permutations for the allele test treat the two marker alleles per individual as separate observations each with the same trait, and the trait value is then permuted across these observations. If there are any STRATA variables, permutations are performed within each stratum. For permutations, the exact -value is estimated as the proportion of times the chi-square statistic from one of the new samples is equal to or exceeds the chi-square statistic from the original sample (Westfall and Young 1993).
Copyright © 2008 by SAS Institute Inc., Cary, NC, USA. All rights reserved.