Data Table
Select the last icon at the bottom of the vertical toolbar to the right of the graph. This switches the Viewer to display the forecast data set as a table, as shown in Figure 45.48.
Figure 45.48: Model Viewer: Forecast Data Table
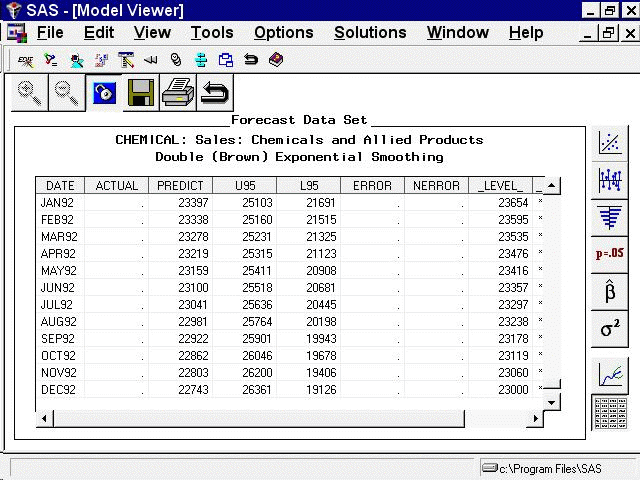
To view the full data set, use the vertical and horizontal scroll bars on the data table or enlarge the window.